
AI Data Center Infrastructure
Power, Compute, and the Conversion Opportunity

This is a guest piece written by Vincent Jow and the Modular Capital team. Please read on — we at Artemis think Vincent and James are two of the best digital finance investors in the world.
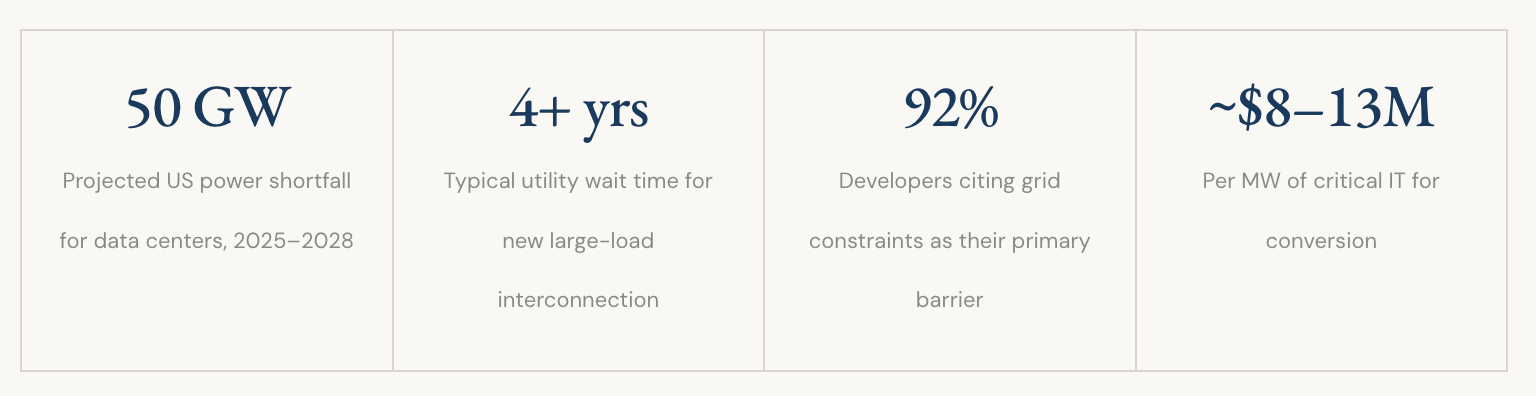
The AI infrastructure buildout is one of the largest capital deployment cycles in technology history and it is constrained not by demand, but by the physical availability of power. The United States faces a projected power deficit of ~50 gigawatts through 2028.
Within this context, operators who already control energized large-scale power such as Bitcoin miners who secured grid infrastructure years in advance, find themselves uniquely positioned to capture a structural premium.
The conversion of mining infrastructure to high-performance computing (HPC) data centers is one of the few near-term ways to bring scarce power capacity to market.

01 The Industry Investment Thesis
Artificial intelligence workloads require sustained high-density power at a scale and speed that the existing grid interconnection process cannot deliver. Training large language models and running GPU-intensive inference tasks demands thousands of chips operating in proximity, drawing electricity at densities that dwarf conventional enterprise data center requirements. The result is a supply/demand dislocation in energized power that is structural, multi-year in duration and largely insensitive to macro conditions. The compute intensity of AI tasks is also evolving in ways that systematically increase power demand per unit of economic output: while a simple chatbot query is computationally modest, chain-of-thought reasoning tasks require 100x the compute, video generation 3,000x, and deep research tasks potentially 1,000,000x the baseline.1 As AI use cases proliferate toward these more computationally intensive agentic applications, the length of tasks have been consistently exponentially increasing over the past 6 years, with a doubling time of around 7 months.2 The aggregate power demand per user and per dollar of AI-driven economic activity will continue to increase regardless of efficiency gains at the chip level.
The Power Bottleneck: AI’s Defining Constraint
The single largest constraint on AI buildout timelines today is not chip availability or software capability, it is electricity. Hyperscaler capital expenditure alone is running at approximately $650 billion this year. Analysis of chip shipment forecasts and announced US data center construction suggests a power deficit of approximately 50 gigawatts between 2025 and 2028, driven by stronger-than-expected semiconductor demand.3 Data centers currently account for only 3–4% of total US grid consumption, but that figure is projected to reach 12% by 2028.9
The scale of individual lab demand illustrates the pressure. OpenAI’s compute footprint has scaled from ~600 MW to ~2 GW and is expected to reach ~6 GW this year, potentially 12 GW next year. Similarly, Anthropic is on a similar trajectory. For every $100 billion of AI revenue generated at 50% gross margins, labs must spend $50 billion on compute, equivalent to 5 GW of capacity at ~$10 billion per GW annually. Given this shortage against overwhelming near-term demand, time to power is the key focus.
The gap cannot be closed quickly. Grid interconnection queues now stretch to four or more years for large loads. ERCOT, the Texas grid operator, alone has approximately 458 GW of pending applications in its interconnection queue.4 In a recent survey, more than half of developers report that securing power has become more difficult over the past twelve months. Utility respondents say time-to-power will take 2 years longer on average than expected by hyperscalers and colocation providers.5 Even within ERCOT, widely regarded as the most accessible US interconnection regime, the minimum timeline is approximately 300 days under ideal conditions, with current average timelines running closer to 3–5 years due to study backlogs.6 PJM, the grid operator that covers Virginia, Ohio, Pennsylvania, and much of the Northeast, is broadly viewed as the most constrained region in the country today, with new large-load interconnection effectively stalled. PJM’s available supply capacity has declined 20% (40 GW) over the last four years, driven by plant retirements.10 Substations required for loads above 100 MW, now effectively universal for AI data center builds, add a further 18–24 months of delivery timeline, with large transformer procurement alone running 2–3 years.
The Power Cost Benchmark: Why Miner Conversions Win on Economics
Other than speed, the decision of where to source power is also a question of all-in cost per MWh, and that cost varies dramatically across the available options. Bitcoin miner conversions represent the lowest-cost path by a wide margin. Miners typically pass power through to tenants at $70–100/MWh, reflecting their underlying contracted rates of $30–50/MWh. Those economics largely reflect power contracts secured years ago, before scarcity became acute.
The alternatives each carry meaningfully higher costs and their own execution constraints:
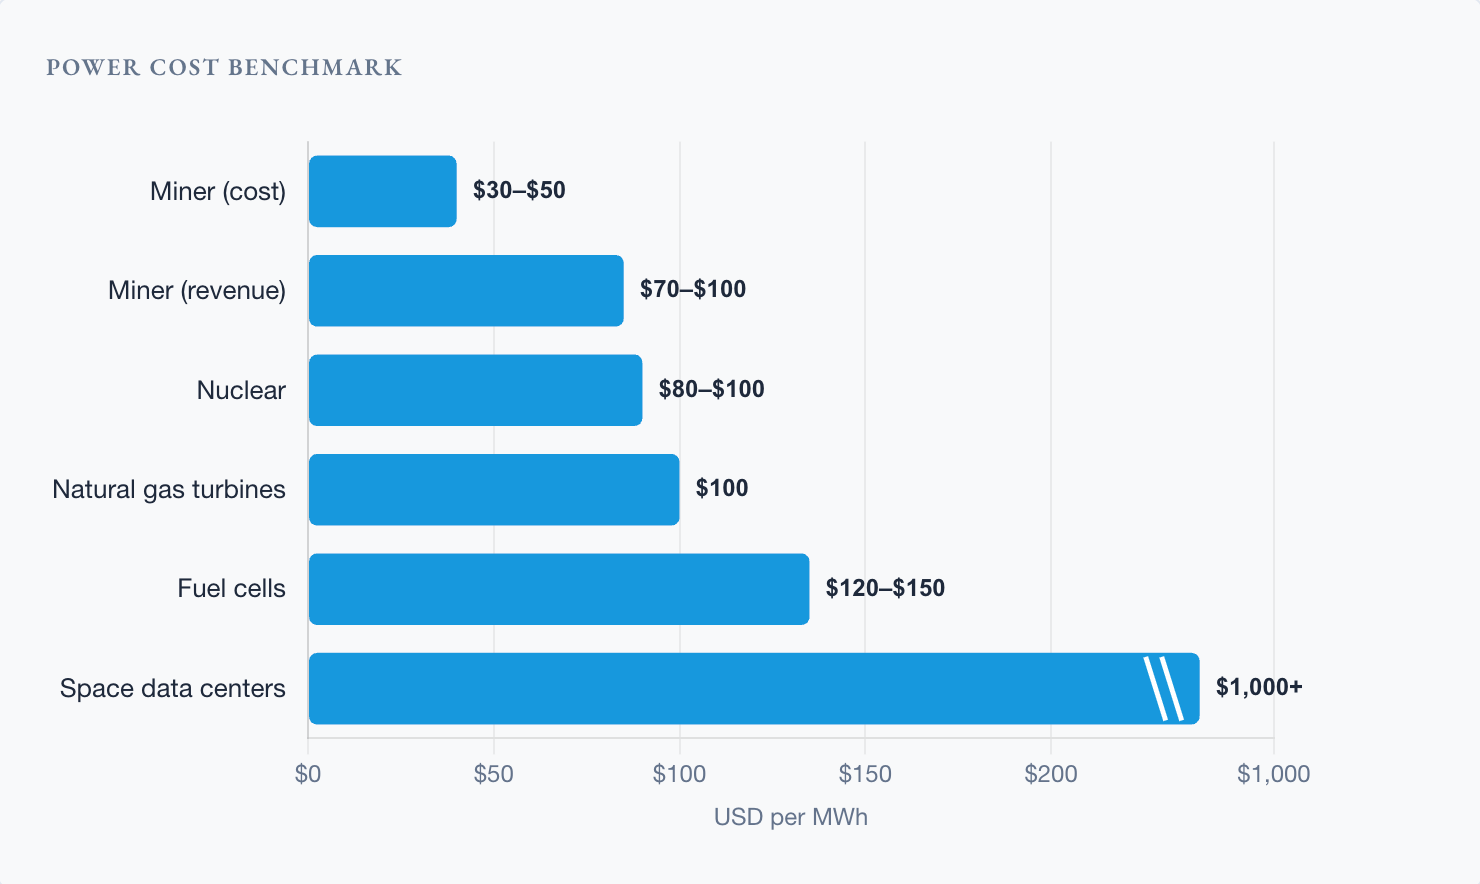
Nuclear: Securing a nuclear power purchase agreement currently costs approximately $80–100/MWh. Nuclear offers firm, 24/7 power with zero carbon emissions, making it attractive to hyperscalers with sustainability commitments, but existing capacity is limited, new nuclear technologies such as small modular reactors (e.g. OKLO, SMR) remain a decade away at scale, and the contracting process is competitive and slow. Constellation Energy (CEG), which operates the largest nuclear fleet in the US with 20 GW of capacity, has already leased ~10% of its fleet to hyperscalers.
Natural gas turbines: Combined-cycle gas turbines are the conventional large-scale power solution, pricing at approximately $100/MWh all-in for behind-the-meter configurations. However, the market for new turbine orders is effectively backlogged. GE Vernova (GEV) and the small number of other major turbine OEMs have order books extending years out, making new turbine-powered capacity largely inaccessible for near-term data center buildouts regardless of price. GEV in particular has a $160B+ backlog and has seen its EBITDA margins expand from 8% in 2025 to 20% by 2028 as they are able to continue to take price.
Fuel cells: Bloom Energy’s (BE) solid oxide fuel cells can be deployed faster than grid interconnection timelines and provide reliable baseload power, but at a cost of approximately $120–150/MWh, roughly 2x the all-in cost available through miner conversions. Suitable as a bridging solution or for smaller loads, but difficult to justify at scale.
Alternative and exotic sources: A broader menu of generation technologies is available for behind-the-meter deployment, such as aircraft, ship and medium-speed reciprocating engines. These options are generally more expensive than grid-connected power, but developers choose them specifically to bypass interconnection queues and permitting timelines. Each technology can contribute meaningfully at the margin but none approaches the cost efficiency of pre-contracted miner power. More speculative configurations such as data centers in space are effectively pre-commercial and likely $1,000+ MWh today.7
The implication for investors is clear, operators with access to pre-contracted miner power at $30–50/MWh hold a structural cost advantage over every alternative path that is not replicable at any price in the near term, with a massive premium on near-term power availability. Announcements such as BE and Oracle’s recent 2.8 GW deal, along with Elon’s comments about data centers in space, highlight how acute the power shortage is and reinforce the view that BTC miner conversion, as the lowest-cost source of power, will be fully utilized before the market is forced toward more expensive and exotic alternatives.
A further structural advantage of Bitcoin site conversions has emerged beyond speed: political and community acceptability. Data center development has become an increasingly contentious issue, with communities pushing back against new builds over concerns about electricity bills and environmental externalities. Recent polling of US registered voters found that 60% hold AI data centers at least partly responsible for rising electricity prices 8. Bitcoin site conversions avoid this friction because they reuse existing grid access rather than requesting new incremental interconnection. An operator adding compute at an existing Bitcoin site does not increase the community’s electricity burden in the way that a greenfield data center does.
The Historical Role of Bitcoin Mining Infrastructure
Bitcoin mining’s role in the AI infrastructure story is primarily historical and structural. Over the preceding decade, miners accumulated large-scale power infrastructure in Texas and other low-cost power markets, securing firm grid interconnection agreements that are now extraordinarily valuable given the scarcity environment. The industry collectively holds over 10 GW of approved capacity across US-listed operators, the single largest pool of readily convertible energized power available to AI developers anywhere in the country. A widely-used industry reference metric puts the revenue potential of this asset class into sharp relief: for every gigawatt of reliably delivered AI colocation capacity, operators can generate approximately $1-2 billion in annual revenue.
For the largest cloud providers, third-party colocation is typically a capacity bridge rather than the preferred long-term model. Hyperscalers and neoclouds turn to third-party colocation specifically when their own data center capacity has been exhausted and hardware risks sitting idle in warehouses unpowered. Given the alternative, GPU fleets generating zero revenue and depreciating while awaiting internal data center completions, the premium paid for ready third-party power is economically rational. The current environment, where internal capacity is fully spoken for across every major cloud provider, has effectively made colocation a necessity.
The economics of mining itself are deteriorating structurally. The scheduled Bitcoin halving, which cuts block rewards in half approximately every four years, progressively compresses mining profitability. With the next halving expected in 2028, the relative attractiveness of contracted HPC cash flows should continue to improve versus pure-play mining economics. This creates a natural and self-reinforcing conversion incentive: as mining margins compress, the relative attractiveness of long-term HPC lease revenues which are predictable, inflation-linked, and completely independent of BTC price grows commensurately.
Site Selection
Miners possess the four physical ingredients that AI developers most need but cannot quickly acquire: firm grid interconnection, large contiguous land parcels, experience managing high-density electrical infrastructure, and often below-market power contracts. There are a few other considerations when evaluating specific sites for conversion:
The convertible share of US mining capacity is more limited than aggregate power figures suggest given power contract terms. Some miners secured favorable power pricing precisely because they agreed to operate as flexible load: when the grid requests curtailment, they shut down. This arrangement is acceptable for Bitcoin mining, which can pause and resume without consequence, but is structurally incompatible with HPC workloads that require continuous, uninterrupted uptime. A data center that may go offline for hours during periods of grid stress cannot credibly host GPU clusters running training jobs or serving live inference traffic. Miners whose power purchase agreements include curtailment provisions, and whose contracts are not near expiration, are effectively unable to convert regardless of their physical infrastructure quality. Those who can renegotiate to firm, non-curtailable power typically face a meaningful price step-up, a cost increase that must be absorbed into lease economics but that unlocks access to the full AI tenant market.
The physical demands of AI infrastructure are also increasing with each GPU generation. Current Blackwell/GB200 systems draw approximately 120 kW per rack; Nvidia’s next-generation Vera Rubin architecture is anticipated to require approximately 180 kW per rack; and NVIDIA’s subsequent Kyber platform is expected to approach 1 MW per rack, a step-change in density that further widens the gap between what legacy mining facilities can support and what leading-edge AI clusters require. Sites that can support next-generation rack densities should command a premium over facilities limited to prior-generation power and cooling configurations.
Workload type also shapes footprint requirements. AI training, which involves running large model training runs across thousands of GPUs simultaneously, concentrates into a small number of very large clusters, often 1 GW or more, where GPU interconnect density and proximity matter most and geographic location is secondary. AI inference, serving live user queries, has fundamentally different requirements: latency sensitivity means inference infrastructure must be distributed across many smaller metro-adjacent sites close to end users.This bifurcation means that the addressable market for large-campus operators (training) and smaller metro-area operators (inference) is genuinely distinct, and that the supply of suitable sites for each workload type differs materially.
Network connectivity is an equally important and often underweighted site selection criterion alongside power. Fiber availability is a gating input for both training and inference workloads, moving large datasets in and out of training clusters requires high-capacity, low-latency connectivity, and inference sites must be well-connected to serve end users with acceptable response times. A site with abundant power but weak fiber connectivity is effectively unusable for high-value AI workloads, regardless of its electricity cost profile.
“Access to energized, large-scale power is the scarcest resource in the AI economy and it cannot be manufactured on demand.”
The Colocation vs. Cloud Services Spectrum
Operators converting mining capacity to HPC can pursue two distinct business models with meaningfully different risk and return profiles.
HPC Colocation is the dominant structure in the current market: the operator constructs a powered shell providing electricity, cooling, and physical infrastructure, while the tenant owns the GPU equipment and IT stack. This model delivers highly predictable revenues (fixed $/MW/year with embedded annual 2-3% escalators) strong EBITDA margins of 80–90%, and significant leverage capacity through debt at 80% LTC. Equity value is estimated at approximately $5–10 million per gross MW. Converting an existing mining site to a fully liquid-cooled AI data center carries an all-in cost of approximately $10 million per MW, reflecting the scope of the rebuild required, which underscores why the quality of the underlying power asset, rather than the legacy mining facility itself, is the primary driver of value in conversion transactions.
Cloud Services is a higher-risk, higher-reward full-stack model in which the operator builds the powered shell but also acquires and operates GPU fleets, selling compute capacity to end users. IREN is a BTC miner which is converting its data centers and buying GPUs to sell to Microsoft directly. This puts them in similar competition with other neoclouds, such as CoreWeave and Nebius. This captures the full economics of GPU utilization but requires substantial ongoing capital expenditure with GPU useful life of 4-5 years, deeper technical capabilities on orchestrating GPU fleets, and exposure to GPU pricing, availability and utilization.
The Hyperscaler vs. Neocloud Tenant Dynamic
The tenant landscape divides into two categories with distinct commercial characteristics. Hyperscalers (e.g. Microsoft, Meta, Google, Amazon) offer superior credit quality and access to cheaper project financing, but negotiate harder on unit economics, prefer to control data center infrastructure, and typically achieve slightly lower developer EBITDA margins. Neocloud operators (e.g. CoreWeave, Fluidstack, Nebius, Lambda, Crusoe) typically have higher financing costs and therefore need to pay higher premiums.
The optimal tenant portfolio blends both: a hyperscaler anchor provides credit quality and lower financing cost; neocloud tenants provide yield enhancement and are typically quicker to execute. Deals partially backstopped by hyperscalers, where a hyperscaler guarantees a neocloud’s lease obligations in exchange for rights as Google has done with Fluidstack and a handful of miners, offer a middle path that has emerged as a meaningful structural innovation in the market.
02 Transaction Comparables
A growing dataset of executed transactions now provides empirical grounding for HPC data center valuations. The following table summarizes the most significant recent colocation deals across US-listed operators, illustrating the range of commercial terms.
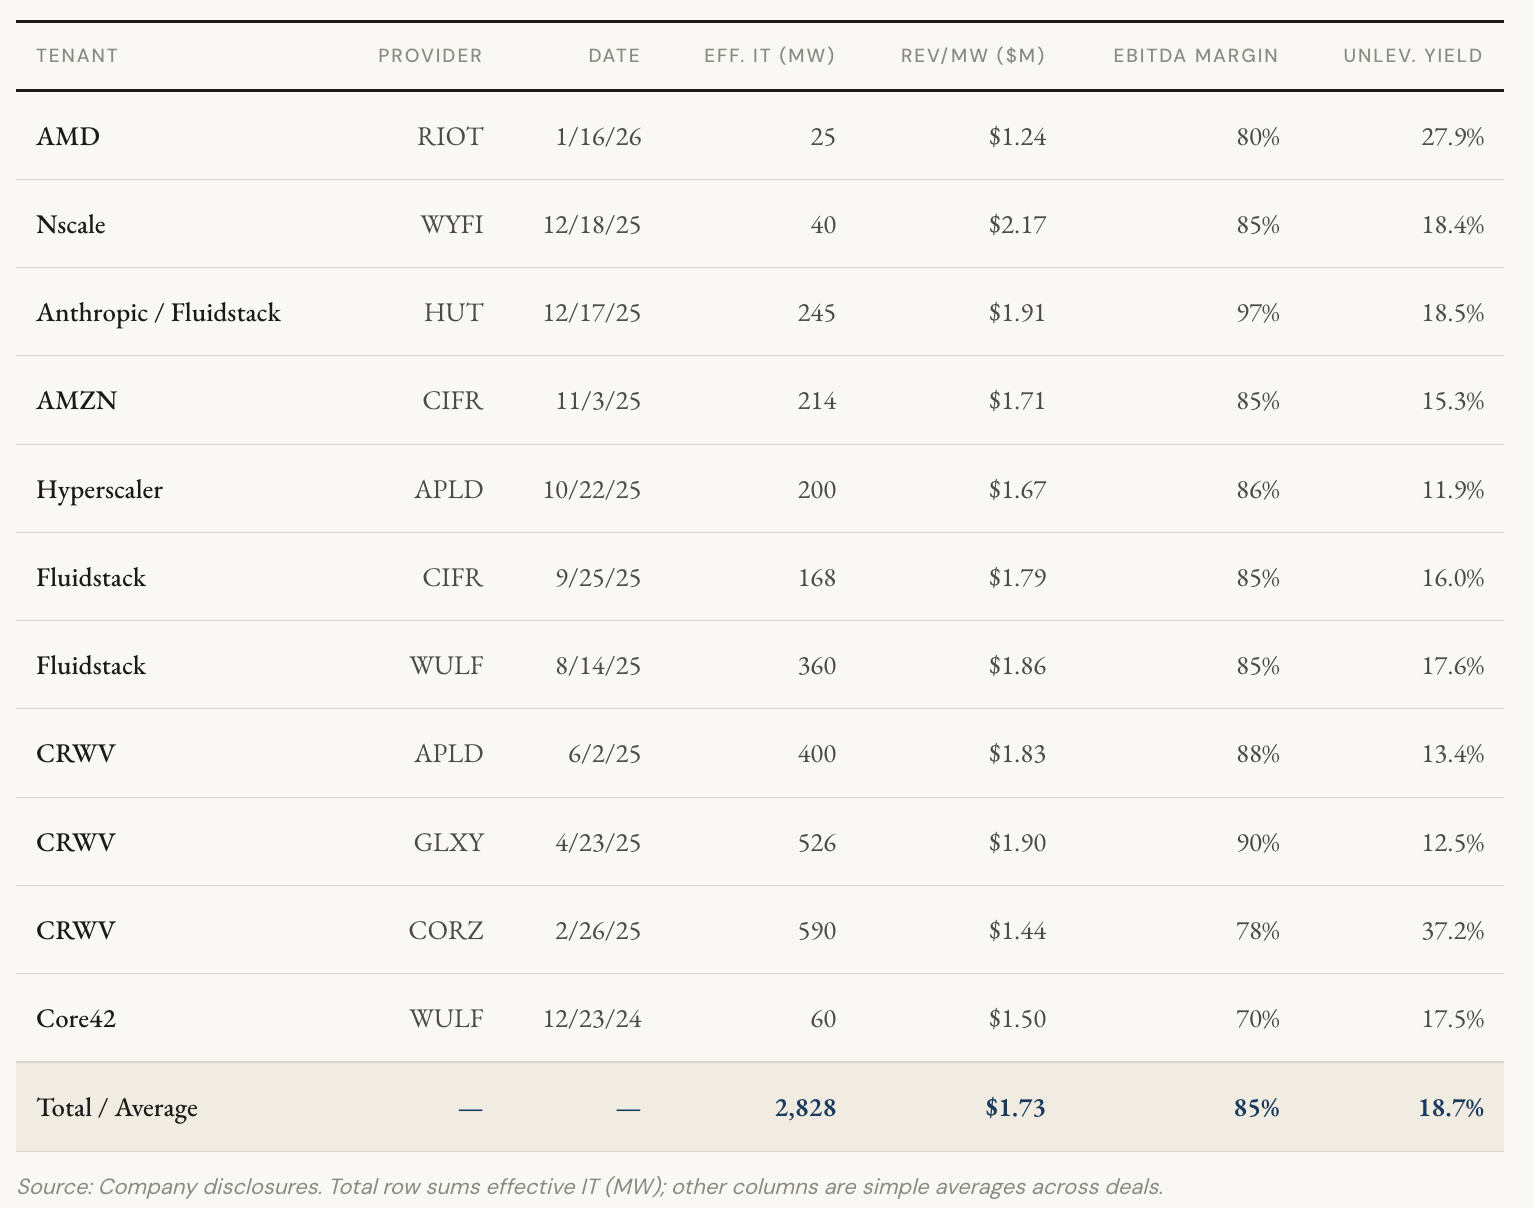
Several important observations emerge from this dataset. Revenue per critical IT watt has generally been trending upwards, reflecting intensifying demand and a tight power supply environment. The value creation per watt generated in successive transactions has been increasing materially, from approximately $5-8/watt in mid-2025 transactions to approximately $10+/watt towards the end of 2025. The broader comp dataset, which shows a rising trend across consecutive deals, suggests the market for energized power is tightening rather than normalizing. Contract tenors have also held consistent with 10–15 year initial terms, with 2–3 five-year renewal options, which improves the terminal value.
03 Operator Landscape: Live Comp Sheet
BTC miner prices are very volatile with an average of 3x beta to Nasdaq and 1.2x to BTC and 10-30% short interest. To keep the analysis useful over time, investors should use the live comp sheet to track where each operator is trading and how it compares with implied NAV.
The comp sheet is intended to be a live valuation tool and comparability across operators requires a standardized lens. One useful cross-sectional measure is adjusted equity value per approved megawatt, calculated as market cap plus debt, less crypto assets, cash, and conversion capex already spent, primarily construction in progress. This adjustment helps normalize for differences in capital structure and project timing, giving investors a cleaner read on how much approved HPC capacity the market is already pricing in.
As an example, using a $7 million per MW benchmark then shows where each operator trades relative to NAV.
How to use the sheet
Start with the deals. The announced transactions here provide a useful reference for where key valuation metrics, including EV per gross MW, revenue per MW, EBITDA margin, and unlevered yield, have cleared.
Select an approved MW value assumption. On the main comp sheet, the chosen value per approved MW can be applied across the peer set. While a single benchmark is useful for screening, individual operators may justify different values depending on power cost, tenant mix, and site quality.
Assign a pipeline probability for each operator. The land and pipeline disclosures here show what each company has said about sites beyond currently approved capacity, allowing investors to apply their own probability of conversion. Pipeline value is currently defaulted to zero.
Analyze the results. The sheet shows the EV/MW multiple implied by the market and the upside or downside relative to NAV. BTC balances update live, so digital asset value flows through in real time.
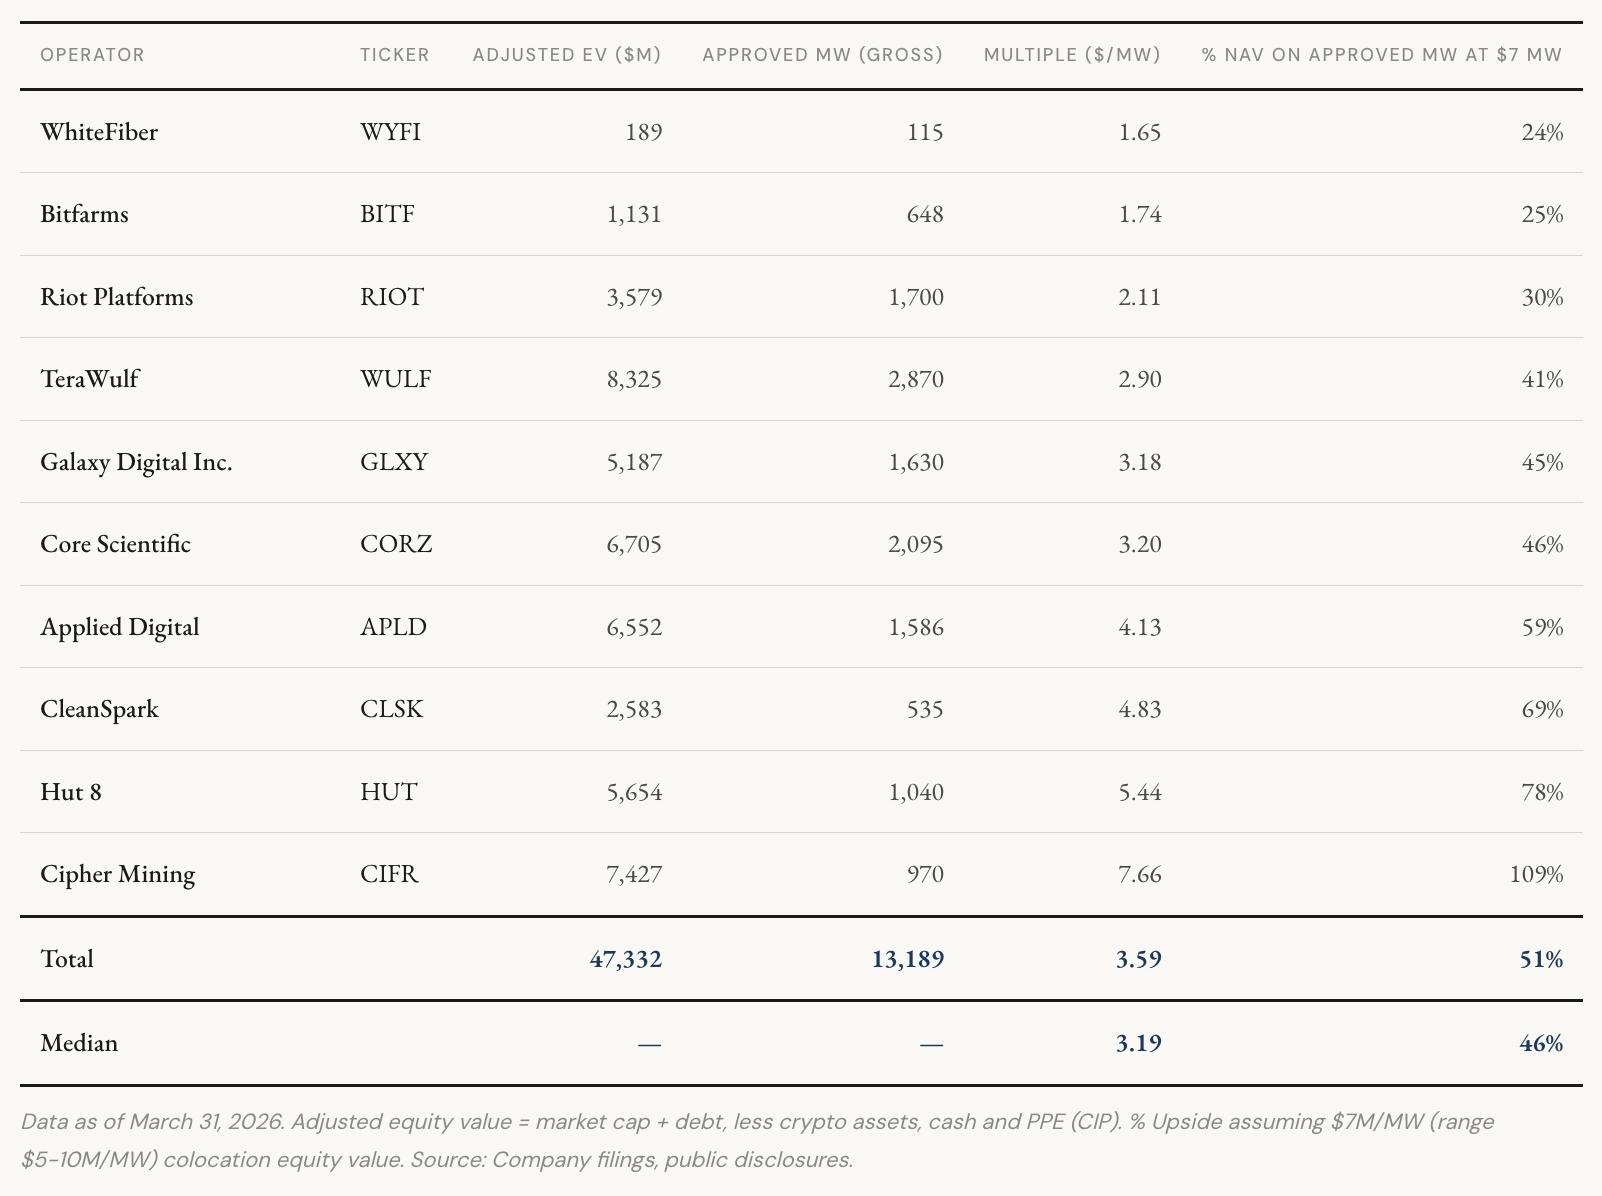
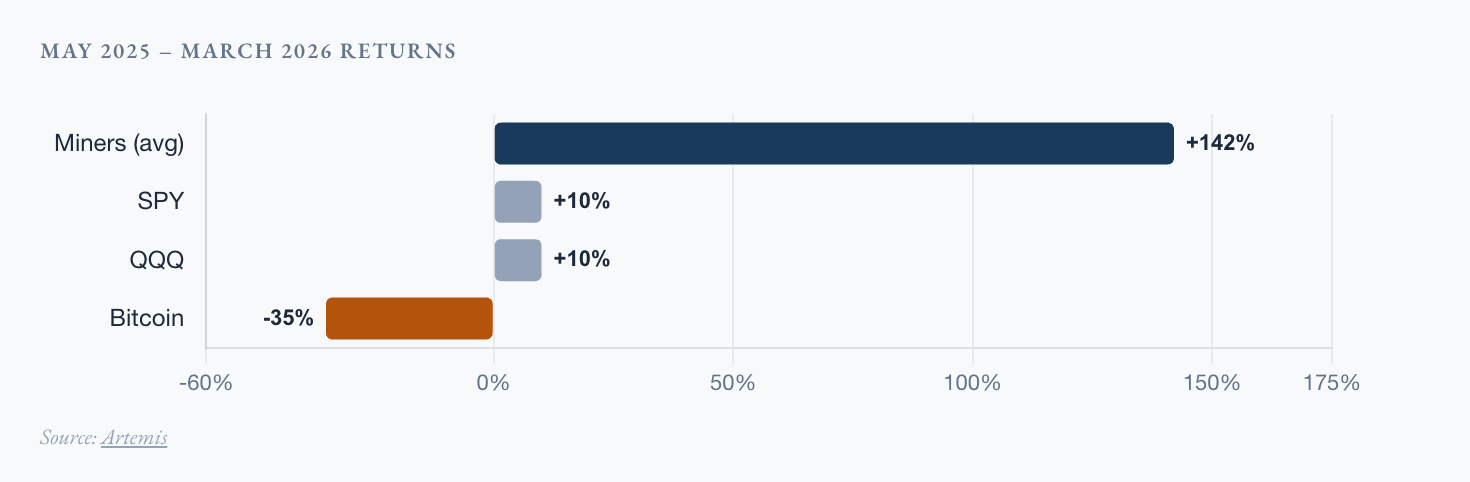
The sector has 13 GW of approved power and is valued at ~$4M equity value per approved MW. Since May of 2025 and following a wave of neocloud deal announcements, the miners on average have gained 142% vs. the S&P 500’s 10% vs. Bitcoin’s -35% over the same period. The market has started to recognize but not yet fully priced the conversion opportunity.
04 Valuation Framework
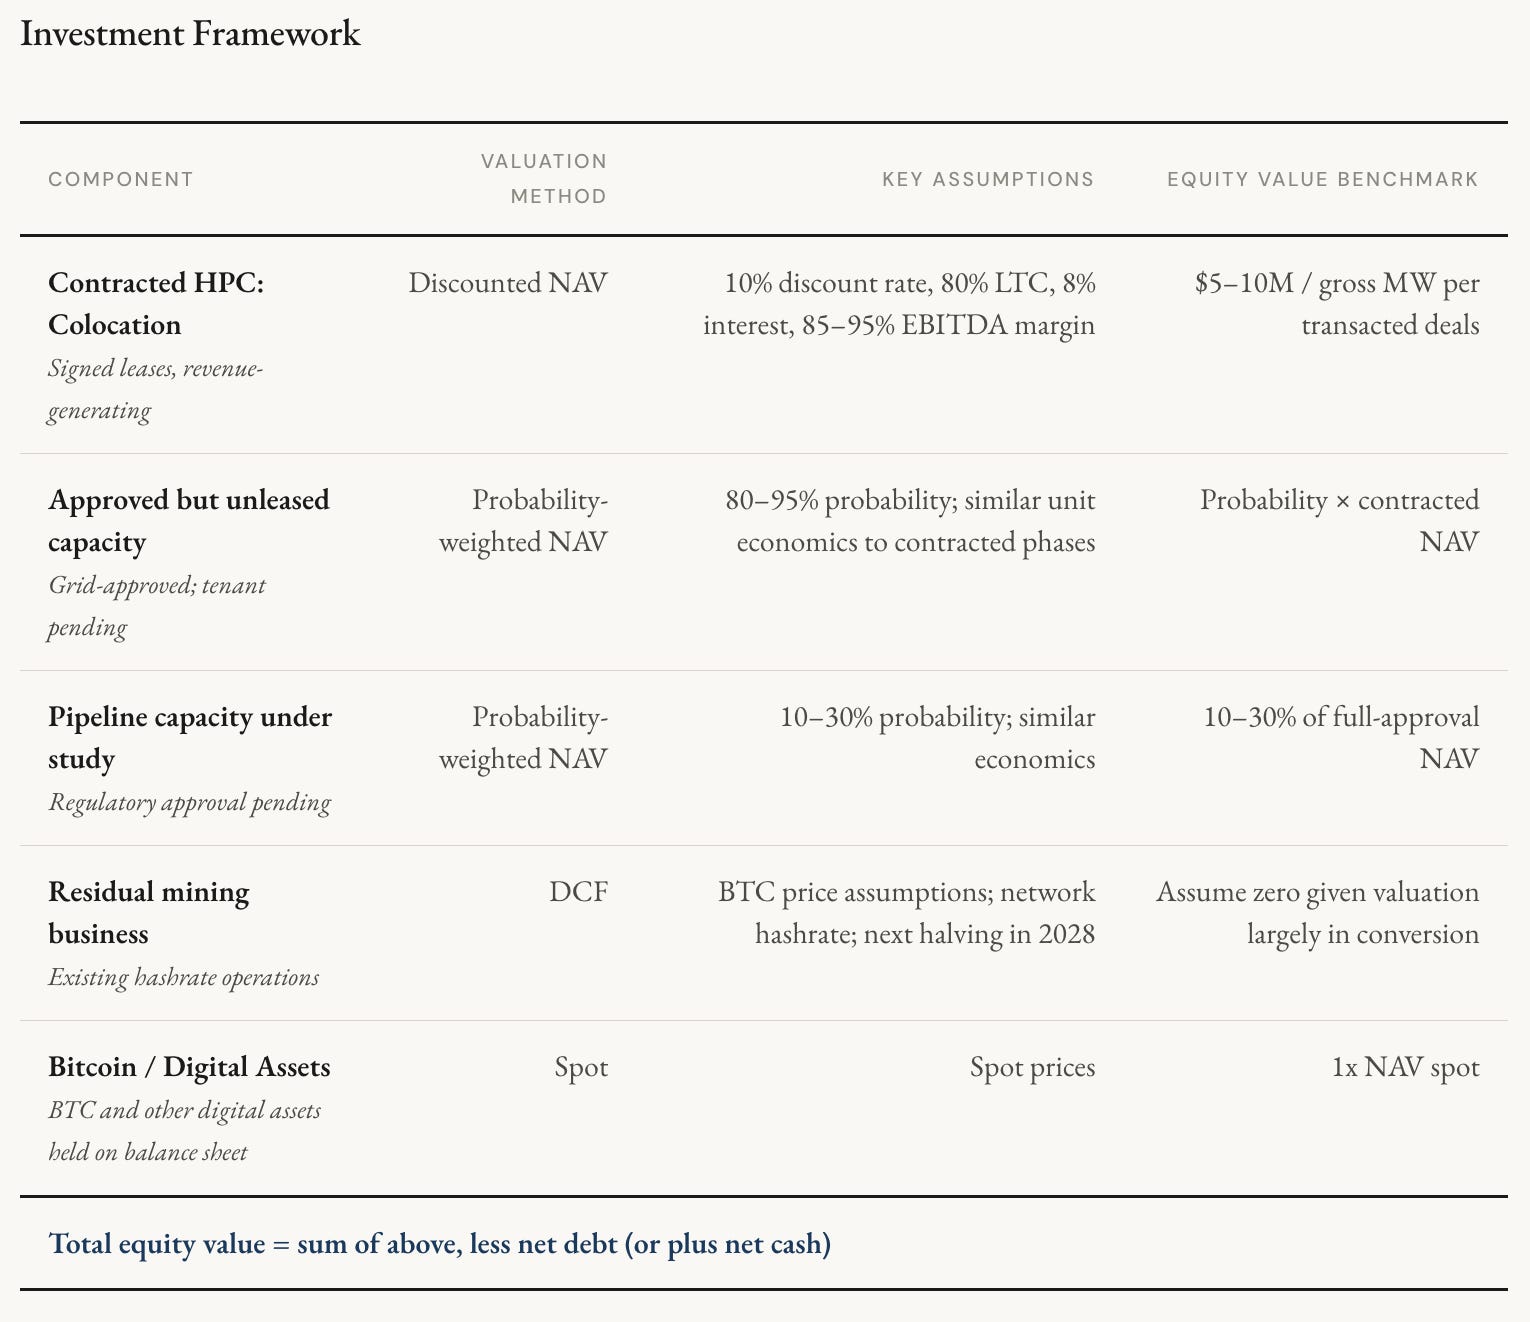
Businesses transitioning from Bitcoin mining to HPC data center operation require a multi-part valuation framework that separately values each company’s specific contracted deals and probability of pipeline and economics, cross-checked against the growing dataset of executed transactions.
Investment Framework
Discounted NAV: Key Inputs and Sensitivities
Revenue per MW: Executed leases have cleared at $1.24–$2.17 per critical IT watt per year, with an average of $1.73. The largest single-campus assets, which can accommodate hyperscale training workloads, may command a premium for their scale advantages: resource pooling, simpler operations management, and proximity to major metro markets for inference latency.
EBITDA margin: Pure colocation with tenant-owned IT achieves EBITDA margins of 80–97% with an average of 85%. Power is the primary operating expense, so margins are driven largely by the spread between the original power lease rate and current market rates, as well as data center premium.
Construction cost and leverage: Capex buildout ranges widely from $3/MW to $14/MW depending on the quality of the existing facility, the planned upgrades (e.g. liquid cooling), time to build, labor costs and how much the tenant is willing to shoulder the construction cost (e.g. in the early Feb. 2025 CRWV/CORZ deal, CRWV shouldered the majority of the capex buildout). At 80% LTC debt financing at 7–9% interest, the observed range in recent project financings, the equity value range spans approximately $5–11 million per gross MW, with the widest spread driven by the interaction of capex assumption, leverage, and discount rate.
Discount rate: The appropriate cost of equity for HPC colocation with contracted, infrastructure-like cash flows with high quality tenants is in the range of 9–13%. A 9% rate reflects a hyperscaler-anchored portfolio and 13% is appropriate for neocloud-only books with concentrated tenant credit. Cloud Services businesses, which carry GPU refresh risk and utilization cycle exposure, will require higher discount rates.
PUE: Power Usage Effectiveness of 1.2-1.5 is the range observed across executed transactions. A 1.2x PUE, the best-in-class figure achievable with advanced cooling, generates 25% higher revenue per gross MW than a 1.5x PUE site at the same headline contracted capacity, creating a material differentiation between operators investing in cooling infrastructure versus those converting legacy mining facilities with limited cooling upgrades.
The REIT Conversion: Material Optionality
An underappreciated dimension of value is the REIT conversion or strategic acquisition optionality embedded in large-scale data center portfolios. An illustrative analysis on a fully built-out 1 Gross GW campus (666 critical MW) generates annual revenue of $1.3 billion at $2M/MW, EBITDA of $1.2 billion at 90% margin, and at a 20-25x EV/EBITDA multiple. These multiples are consistent with where traded data center REITs such as Equinix and Digital Realty have traded. This results in a $27 billion enterprise value. Assuming an initial buildout cost of $10M/MW ($6.6B) with 80% LTC results in an initial equity cost of $1.3B and debt of $5.3B. The resulting equity value is $22 billion. This represents ~17x on the equity invested in construction.
Even a partial monetization, such as a sale-leaseback of completed phases to a data center REIT, would crystallize embedded value at multiples well above current market implied valuations and provide capital to fund subsequent phases without dilutive equity issuance. This optionality is excluded from most base-case models and represents a layer of upside that is real, precedented in the broader data center industry.
05 Investment Selection Criteria
Not all participants in this space warrant equivalent conviction. The following criteria differentiate operators with durable competitive advantages from those exposed to commodity dynamics or execution risk.
Power Portfolio Quality
Scale and quality of energized power: Operators with 500+ MW already contracted and revenue-generating have passed the most difficult execution hurdles. Large single-campus sites, where total potential capacity exceeds 1 GW, command a premium for their ability to serve hyperscale training workloads that require physically co-located compute. The benefits of scale include optimized resource pooling across GPU jobs, higher overall utilization, simpler operational management, and greater flexibility in tenant configuration. Critically, the power must be firm, contractually non-curtailable, rather than flexible load. Mining sites with interruptible power agreements are structurally incompatible with AI tenants regardless of their physical scale, and the ability to demonstrate firm, uninterrupted power delivery is now a threshold requirement in tenant due diligence.
Pipeline credibility and queue seniority: Applications that have already been included in ERCOT batch zero. A significant share of pending interconnection applications are speculative, submitted without committed capital behind them, which clogs queues for legitimate applicants.
Power cost advantages: Sites with below-market power contracts ($40–50/MWh versus $70–80/MWh in primary markets) offer a structural cost advantage that compounds over multi-decade tenors. Critically, they also provide a higher-quality conversion proposition for tenants, lower power cost at source means the developer can offer competitive lease rates while maintaining strong margins.
Site attributes beyond power (fiber and community): Network connectivity is a gating input that is frequently underweighted in site-level analysis. A site without high-capacity fiber access is effectively unusable for inference workloads regardless of its power profile, and training clusters require robust connectivity to move large datasets. Equally important, and increasingly so, is community perception and local political positioning. Data center opposition has intensified as electricity prices rise; communities that feel they are subsidizing hyperscaler power costs become increasingly hostile to new builds. Operators who reuse existing mining sites avoid new interconnection requests and thus sidestep this friction.
Execution Capability and Financial Position
Construction track record: Management teams that have successfully delivered data center builds on time and on budget at significant scale command a valuation premium. A small initial GPU or HPC proof-of-concept build, even at modest scale, provides validation of design and execution capabilities that substantially de-risks subsequent announcements of larger colocation deals.
Balance sheet and self-funding capacity: Excess cash plus bitcoin holdings represent internal capital that can fund equity checks without dilutive external financing. Operators with meaningful mining cash flows can bridge between phases without returning to capital markets at inopportune times.
Tenant diversification: No single tenant should represent more than 50% of contracted revenue. A mix of hyperscaler and neocloud tenants provides credit protection and commercial flexibility. The hyperscaler backstop structure, where a major cloud provider guarantees a neocloud lease, is the optimal structure for investors seeking credit quality while preserving yield.
Relative Value: The Market-Implied Conversion Screen
Adjusted equity value vs. approved capacity: The central valuation signal in this space is the gap between the market’s implied HPC conversion (adjusted equity value divided by $7M/MW) and the operator’s actual approved power capacity. Operators where this ratio is below 50%, implying the market assigns zero value to more than half of approved capacity, represent the most asymmetric entry points, assuming the underlying conversion thesis is credible.
Platform optionality beyond current campus: Operators who have reviewed multiple prospective sites beyond their primary campus and progressed a subset for further development transform the HPC buildout from a single-asset story into a replicable platform business. Each incremental site adds optionality not captured in base-case SOTP models and supports a platform multiple premium over single-asset valuations.
“The floor valuation is contractually anchored by long-dated leases. The optionality is not fully priced while having bounded downside.”
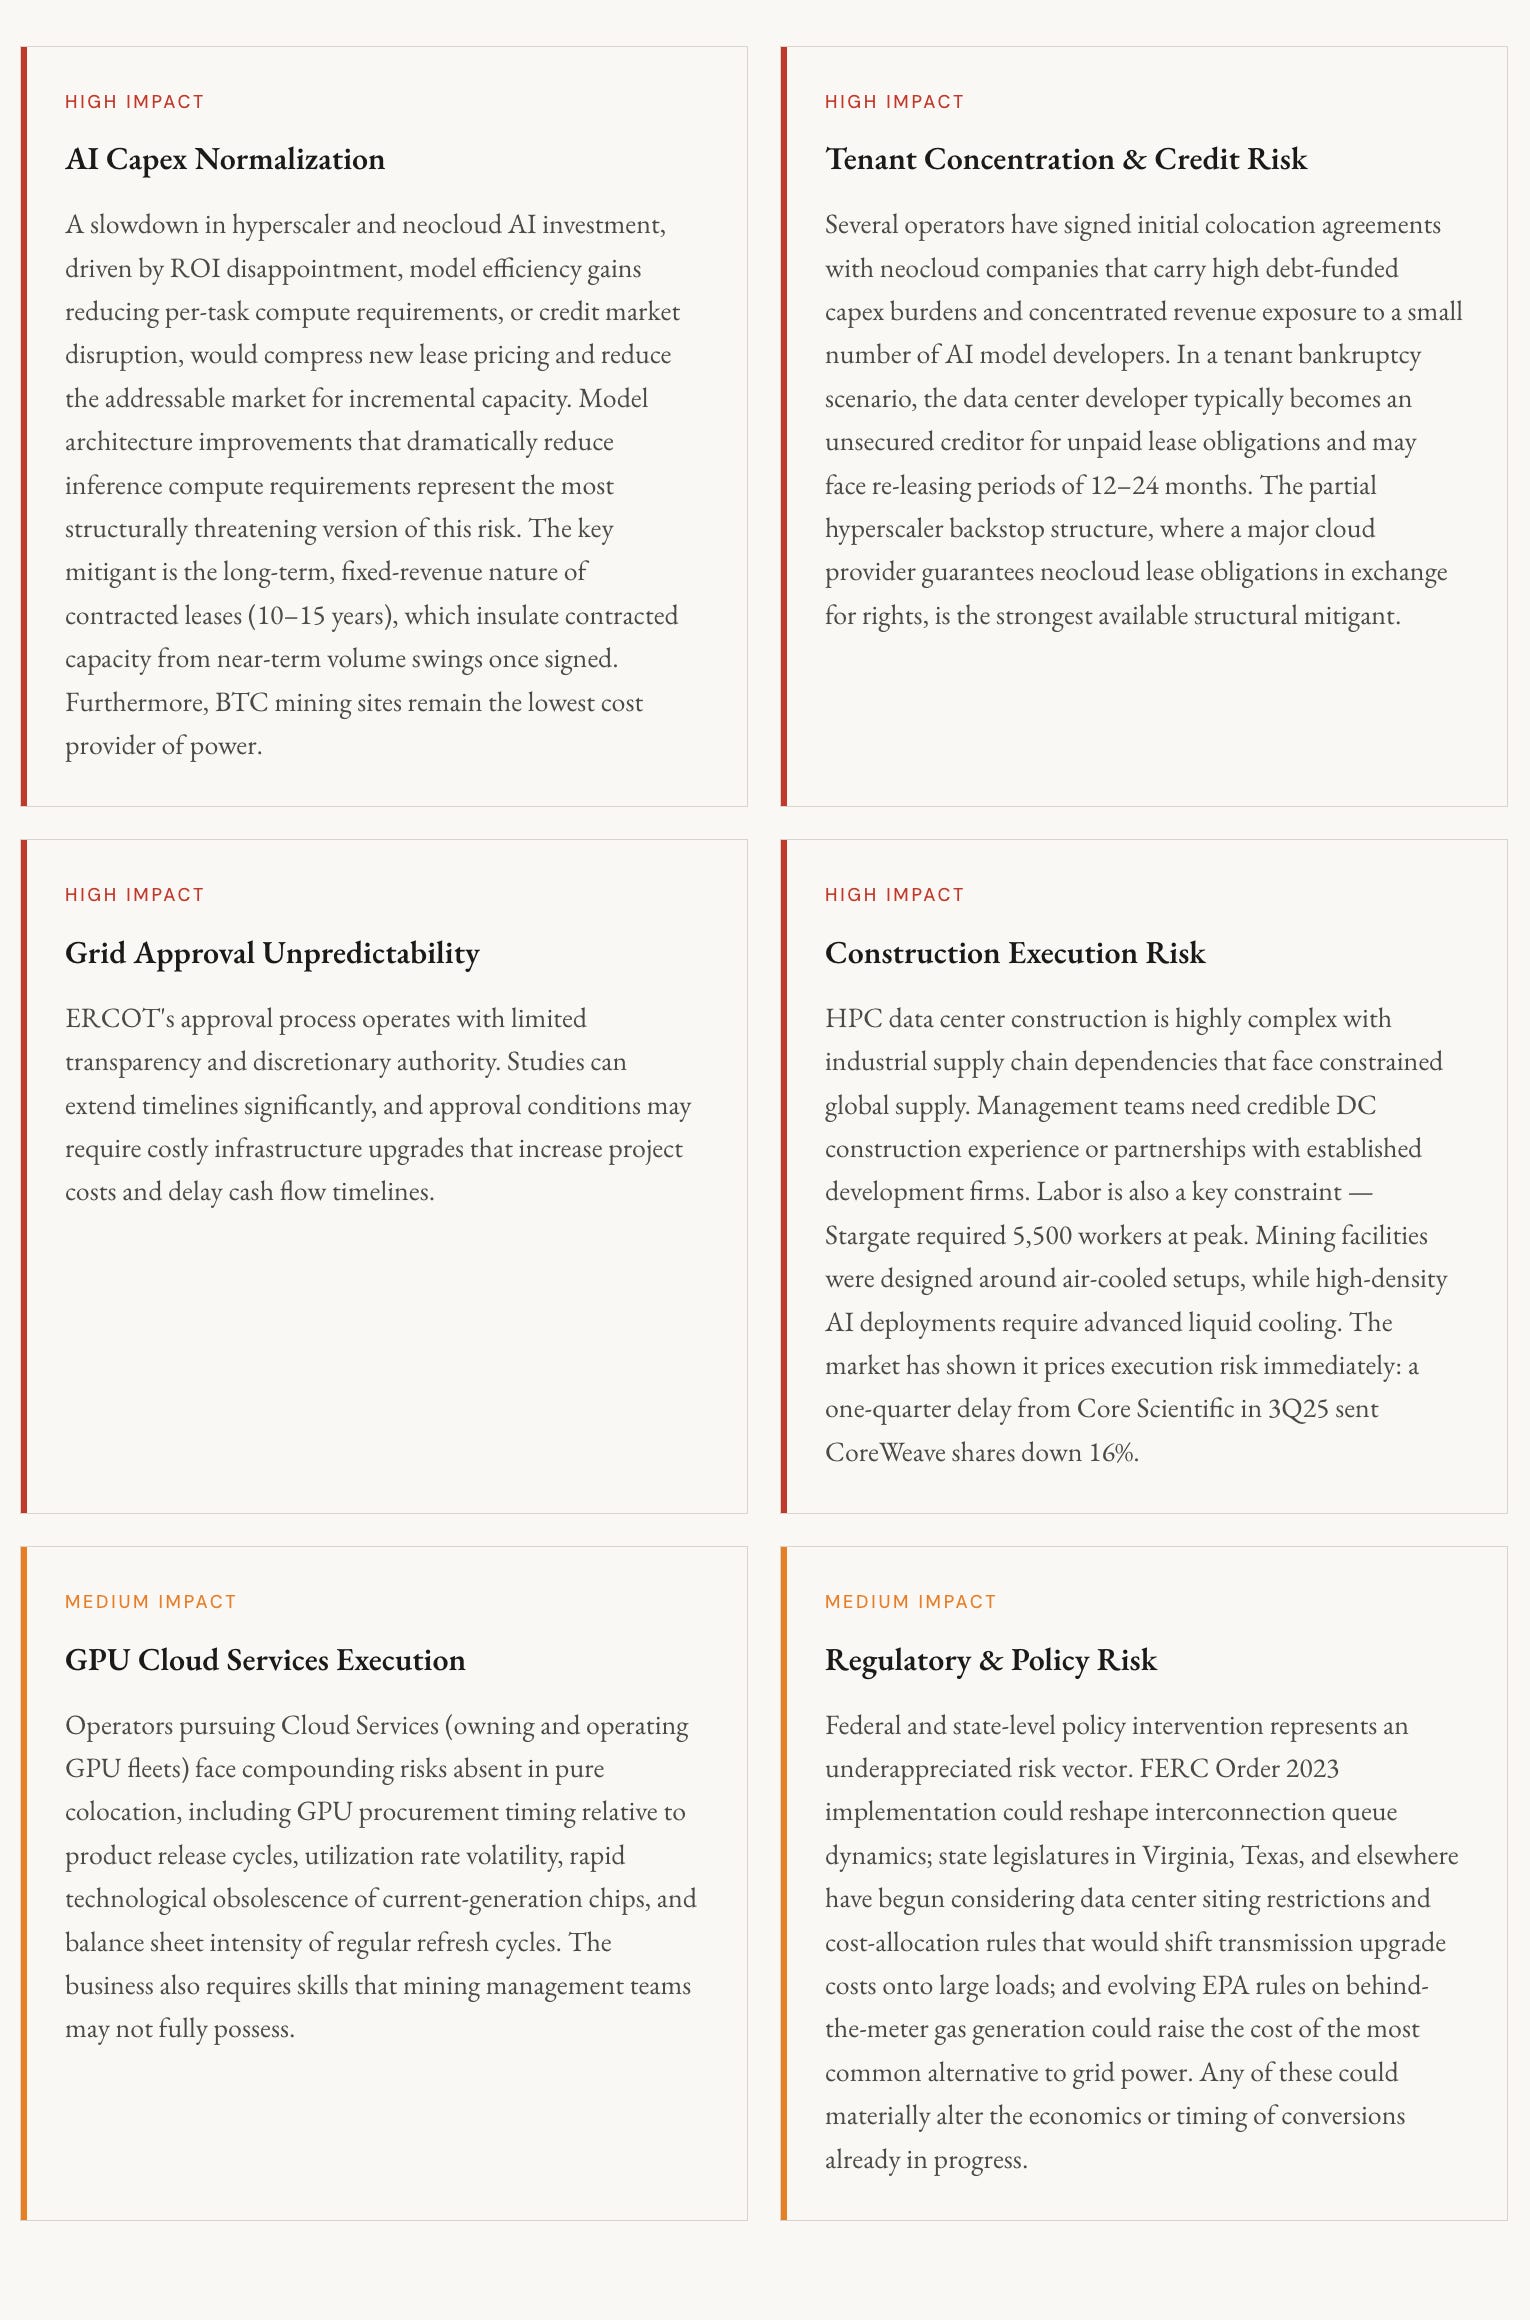
06 Key Risks & Mitigants
A few of the key risks and their corresponding structural mitigants are detailed below.
07 Catalysts
The following observable events are likely to materially re-rate valuations over the next 12–24 months.
ERCOT approval announcements: ERCOT has transitioned to a batch approval process with batch zero likely being approved by 1Q27. Approvals are binary events that have historically produced significant single-session share price moves for affected operators. Critically, approval unlocks the immediate ability to announce tenant agreements, management teams have indicated the pace of tenant interest is such that announcements would likely follow within weeks of grid clearance.
Continued large-scale tenant announcements: The commercial terms disclosed in lease announcements (revenue per MW, contract tenor, tenant identity and credit profile) allow for direct NAV recalibration. A hyperscaler anchor deal, indicating lower yield but superior credit relative to neocloud deals to date, would be read as de-risking the portfolio and could attract a REIT-style valuation multiple for the contracted portfolio.
Strategic M&A (hyperscaler acquisition of an operator): Direct hyperscaler acquisition of a miner-developer would validate the strategic value of energized power assets at multiples well above current market levels, crystallizing embedded value and re-rating the entire comparable set. This precedent has already been partially set (Google getting equity via warrants in CIFR and WULF) and represents a plausible exit pathway for multiple operators.
Activist pressure on reluctant operators: Several operators have been slow to pivot from Bitcoin mining to HPC, and activists have increasingly stepped in to force the issue. BTDR reversed course on conversion following shareholder pressure, and Starboard Value has publicly pushed RIOT to accelerate its HPC strategy. Additional campaigns are likely at operators whose market-implied conversion discount is widest, and each successful campaign acts as both a company-specific and sector-wide re-rating catalyst.
Continued headlines on power and compute scarcity: Each new report of compute and power shortages reinforces the scarcity narrative. Sustained media coverage tightens the spread between energized power and the broader market, and has historically coincided with sector-wide multiple expansion.
Next Bitcoin halving (expected 2Q28): Block rewards will be halved again, accelerating the economic rationale for conversion for any remaining pure-play miners and further reducing the opportunity cost of pivoting to HPC colocation, incrementally expanding the supply of motivated conversion candidates.
08 Conclusion
The AI infrastructure buildout is the dominant capital deployment theme of the current technology cycle, and power scarcity is its defining constraint. The United States faces a 50 GW power deficit for data centers through 2028, a gap that cannot be closed quickly through the normal grid interconnection process. Within this context, operators who already control energized large-scale power, assembled through Bitcoin mining operations over the preceding decade, hold a structural advantage that billions of dollars in fresh capital cannot quickly replicate.
The transaction dataset is now sufficient to anchor valuation with confidence: deals have cleared at $1.25–$2.20 per critical IT watt per year with 80–97% EBITDA margins and equity values of $5–10 million per gross MW in colocation. Applied against the publicly disclosed approved capacity of listed operators, the sector in aggregate is pricing approximately 50% of approved capacity as converted, with optionality in the pipeline.
The most asymmetric opportunities are where this ratio is lowest: operators with large approved portfolios, credible execution track records, and adjusted equity values implying conversion of only 35–45% of approved capacity. For these operators, each incremental grid approval and tenant announcement is a step-change event and the gap between the contracted-capacity valuation floor and the full-portfolio bull case is wide enough to generate compelling returns even under base-case conversion assumptions.
Footnotes
Morgan Stanley
2026 Data Center Report, Data Center Frontier
Disclaimers
THIS POST IS FOR INFORMATIONAL PURPOSES ONLY AND SHOULD NOT BE RELIED UPON AS INVESTMENT ADVICE. This post has been prepared by Modular Capital Investments, LLC (”Modular Capital”) and is not intended to be (and may not be relied on in any manner as) legal, tax, investment, accounting or other advice or as an offer to sell or a solicitation of an offer to buy any securities of any investment product or any investment advisory service. The information contained in this post is superseded by, and is qualified in its entirety by, such offering materials.
CONFLICTS OF INTEREST. As of the date of this post, Modular Capital and/or its affiliates, principals, and employees may hold long or short positions in the securities of issuers referenced herein, including those discussed as investment opportunities. Such interests may conflict with the interests of readers. This post reflects the views of Modular Capital only and should not be construed as objective or independent research. Modular Capital has no obligation to disclose changes to its positions.
THIS POST IS NOT A RECOMMENDATION FOR ANY SECURITY OR INVESTMENT. References to any portfolio investment are intended to illustrate the application of Modular Capital’s investment process only and should not be used as the basis for making any decision about purchasing, holding or selling any securities. Nothing herein should be interpreted or used in any manner as investment advice. The information provided about these portfolio investments is intended to be illustrative and it is not intended to be used as an indication of the current or future performance of Modular Capital’s portfolio investments.
AN INVESTMENT IN A FUND ENTAILS A HIGH DEGREE OF RISK, INCLUDING THE RISK OF LOSS. There is no assurance that a Fund’s investment objective will be achieved or that investors will receive a return on their capital. Investors must read and understand all the risks described in a Fund’s final confidential private placement memorandum and/or the related subscription posts before making a commitment. The recipient also must consult its own legal, accounting and tax advisors as to the legal, business, tax and related matters concerning the information contained in this post to make an independent determination and consequences of a potential investment in a Fund, including US federal, state, local and non-US tax consequences.
PAST PERFORMANCE IS NOT INDICATIVE OF FUTURE RESULTS OR A GUARANTEE OF FUTURE RETURNS. The performance of any portfolio investments discussed in this post is not necessarily indicative of future performance, and you should not assume that investments in the future will be profitable or will equal the performance of past portfolio investments. Investors should consider the content of this post in conjunction with investment fund quarterly reports, financial statements and other disclosures regarding the valuations and performance of the specific investments discussed herein. Unless otherwise noted, performance is unaudited.
DO NOT RELY ON ANY OPINIONS, PREDICTIONS, PROJECTIONS OR FORWARD-LOOKING STATEMENTS CONTAINED HEREIN. Certain information contained in this post constitutes “forward-looking statements” that are inherently unreliable and actual events or results may differ materially from those reflected or contemplated herein. Modular Capital does not make any assurance as to the accuracy of those predictions or forward-looking statements. Modular Capital expressly disclaims any obligation or undertaking to update or revise any such forward-looking statements. The views and opinions expressed herein are those of Modular Capital as of the date hereof and are subject to change based on prevailing market and economic conditions and will not be updated or supplemented. Any projections, estimates, forecasts, targets, prospects, and/or opinions expressed in this blog are subject to change without notice and may differ or be contrary to opinions expressed by others.
EXTERNAL SOURCES. Certain information contained herein has been obtained from third-party sources. Although Modular Capital believes the information from such sources to be reliable, Modular Capital makes no representation as to its accuracy or completeness. This post may contain links to third-party websites (”External Sites”). The existence of any such link does not constitute an endorsement of such websites, the content of the websites, or the operators of the websites. These links are provided solely as a convenience to you and not as an endorsement by us of the content on such External Sites.
 | A guest post by
|