
Artemis Crypto Factor Model Analysis: June 2026 Update
An update on how beta, size, value, momentum, fundamentals, and stablecoins systematically drove crypto returns over the past month.

Executive Summary
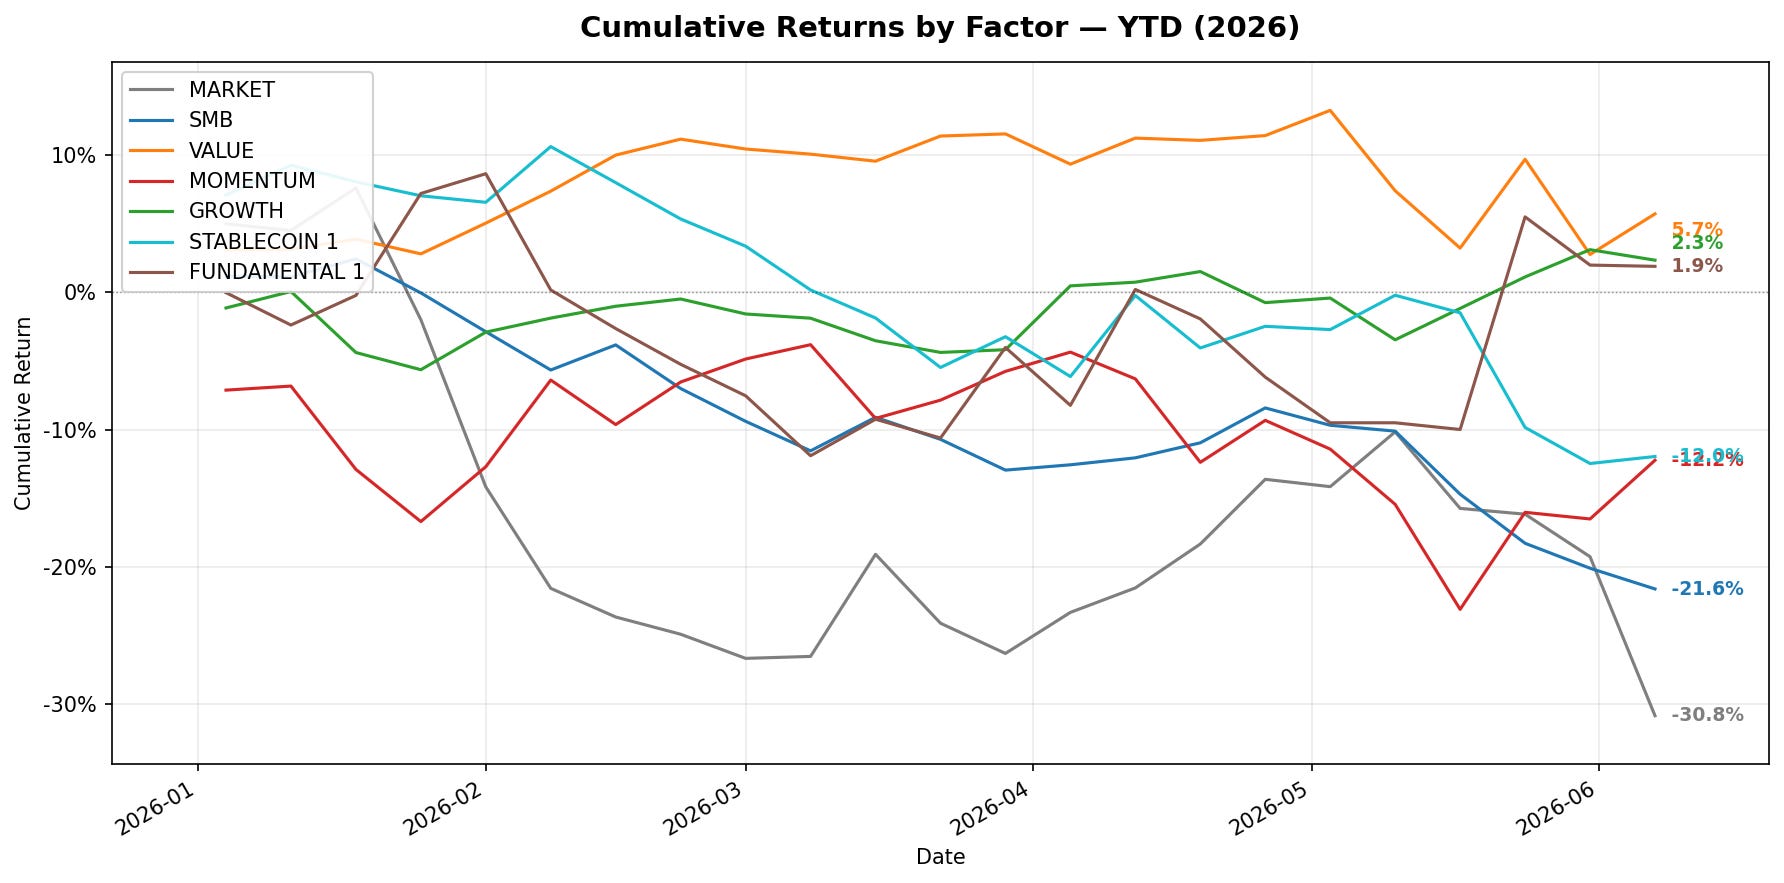
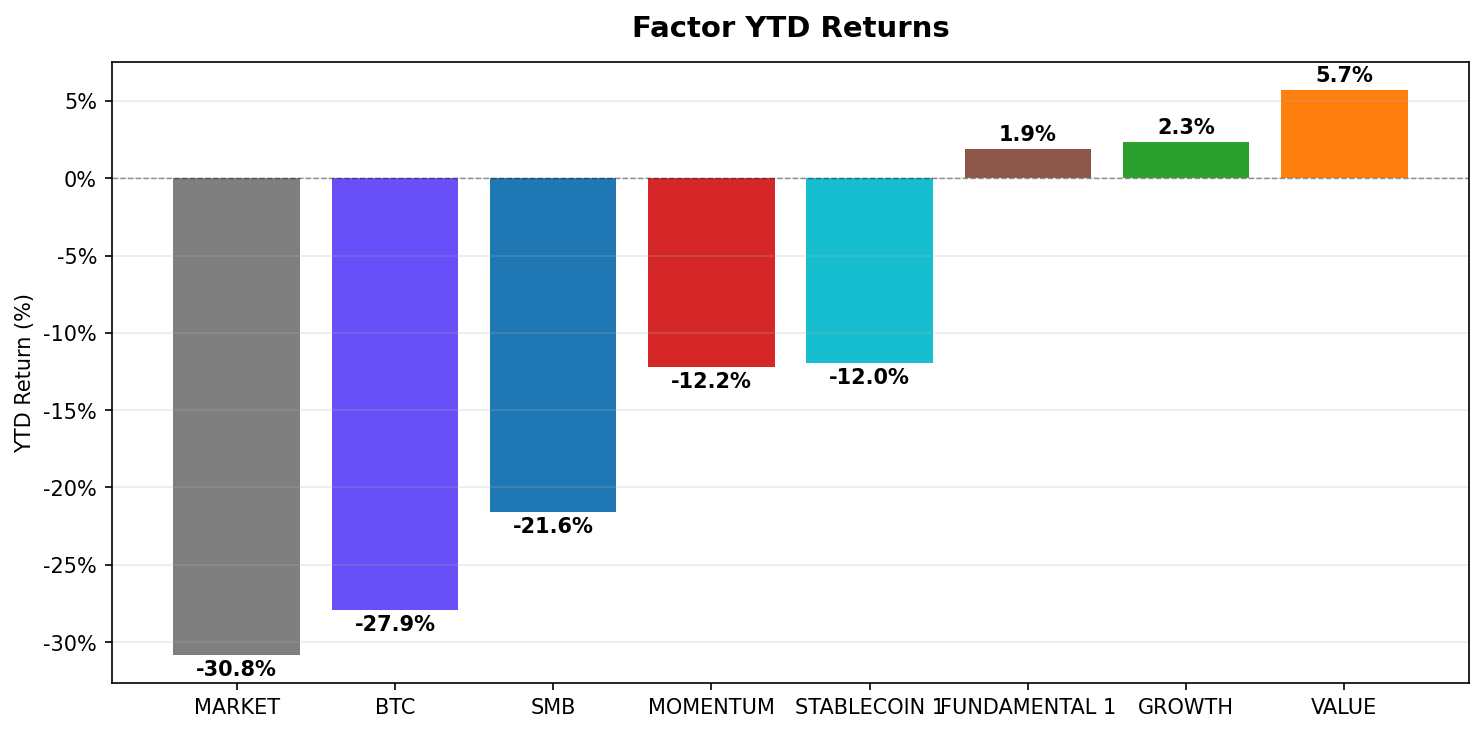
Risk-off May: Five of seven factors were negative as BTC fell 6.5% and ETH fell 15.4%, reflecting broad crypto market weakness. Only Fundamental 1 (+8.7%) and Growth (+3.9%) held positive ground.
Quality signals outperformed price signals: Both positive factors rely on on-chain activity metrics rather than price momentum. Momentum (-7.9%), SMB (-12.8%), and Stablecoin 1 (-10.3%), all price- or flow-based, underperformed meaningfully.
XLM was the month’s breakout: Stellar Lumens surged ~52% in May, appearing as a top contributor across Growth, Fundamental 1, and as a painful short-side loss in Value and Momentum, making it the single most consequential asset across the factor suite.
Large caps squeezed small-cap shorts: HYPE (+69.5%) and NEAR (+66.9%) surged, delivering SMB’s worst month of 2026. The factor’s short (large-cap) book bore the brunt, underscoring the concentration risk in thin crypto markets.
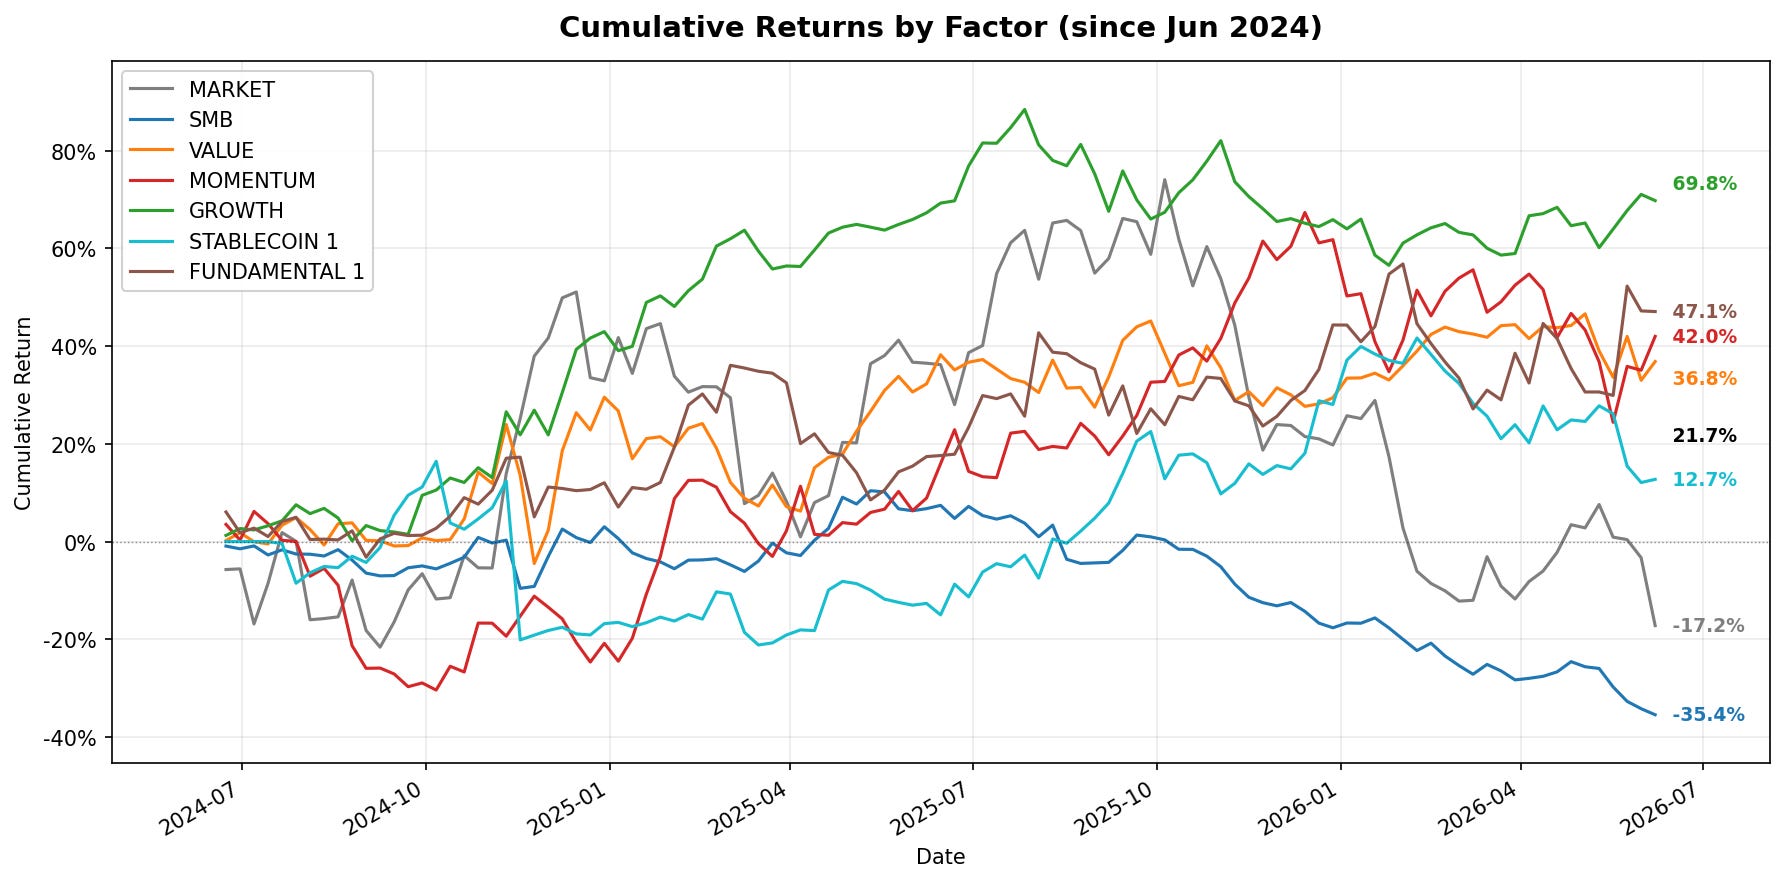
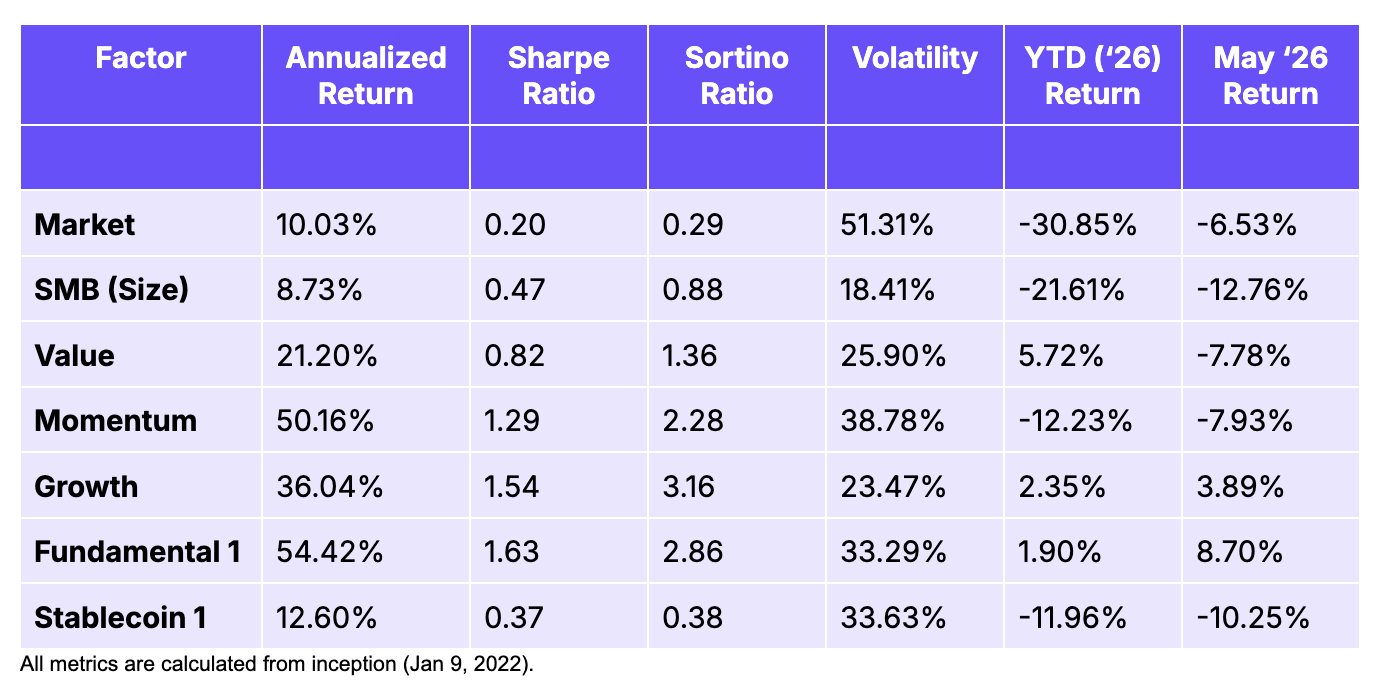
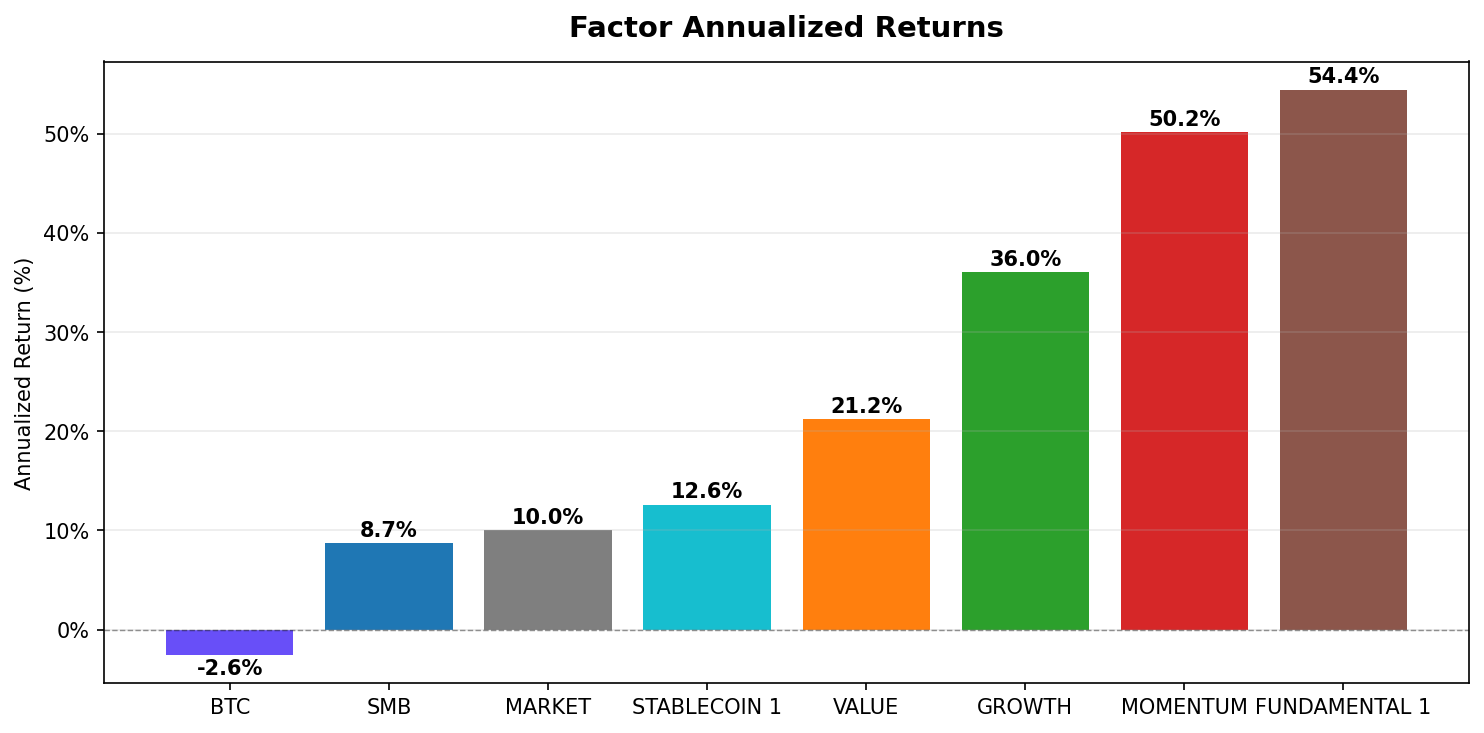
Long-run edge remains intact: Fundamental 1 (1.63 Sharpe), Growth (1.54), and Momentum (1.29) continue to show strong risk-adjusted performance since inception, reinforcing the case for systematic factor exposure across crypto cycles.
Market Context
May 2026 proved a challenging month for systematic factor strategies, with five of seven factors posting negative returns amid a broad crypto drawdown. BTC fell 6.5% and ETH lost 15.4%, dragging market-cap-weighted exposure lower. The two standout performers were Fundamental 1 (+8.70%) and Growth (+3.89%), both of which isolate on-chain activity signals over price momentum, suggesting that assets with genuine protocol usage held up and in some cases rallied sharply versus the broader market. SMB was the worst performer (-12.76%): large-cap names like HYPE and NEAR surged unexpectedly, creating losses for the small-long/large-short construction. Momentum (-7.93%) and Value (-7.78%) gave back recent gains as the risk-off rotation compressed dispersion across the board. Stablecoin 1 (-10.25%) was hurt by adverse chain-flow reversals.
For a more in depth look into how each of the strategies were built, see our Crypto Factor Model Analysis, Fundamentals 1 strategy, and Stablecoins 1 strategy. For a complementary guide on reading through this report, see our factors guide.
Performance Summary
Market Risk Factor
Construction
Long-only portfolio of the top 10 assets by market cap, market cap-weighted, rebalanced weekly. Captures broad crypto market exposure similar to a crypto index.
Current Holdings
BTC (75.9%), ETH (12.2%), BNB (4.9%), XRP (4.3%), HYPE (0.8%), ZEC (0.4%), XLM (0.4%), CC (0.4%), ADA (0.4%), LINK (0.3%)
Performance Metrics
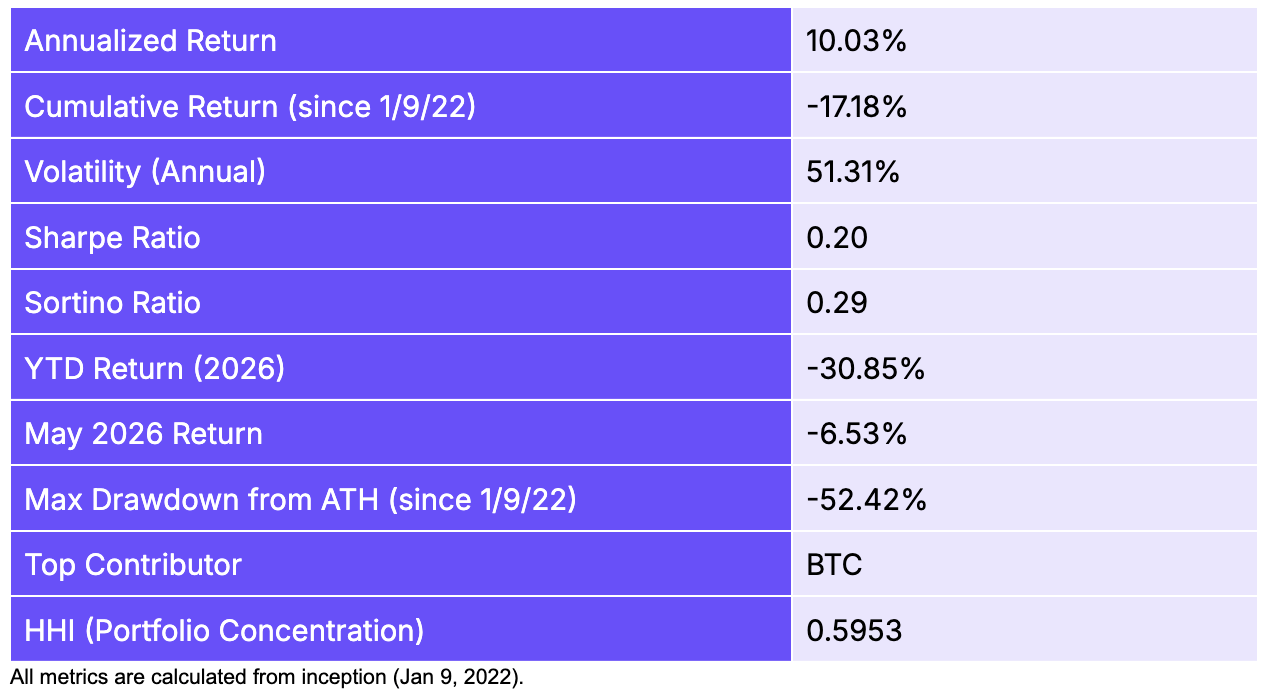
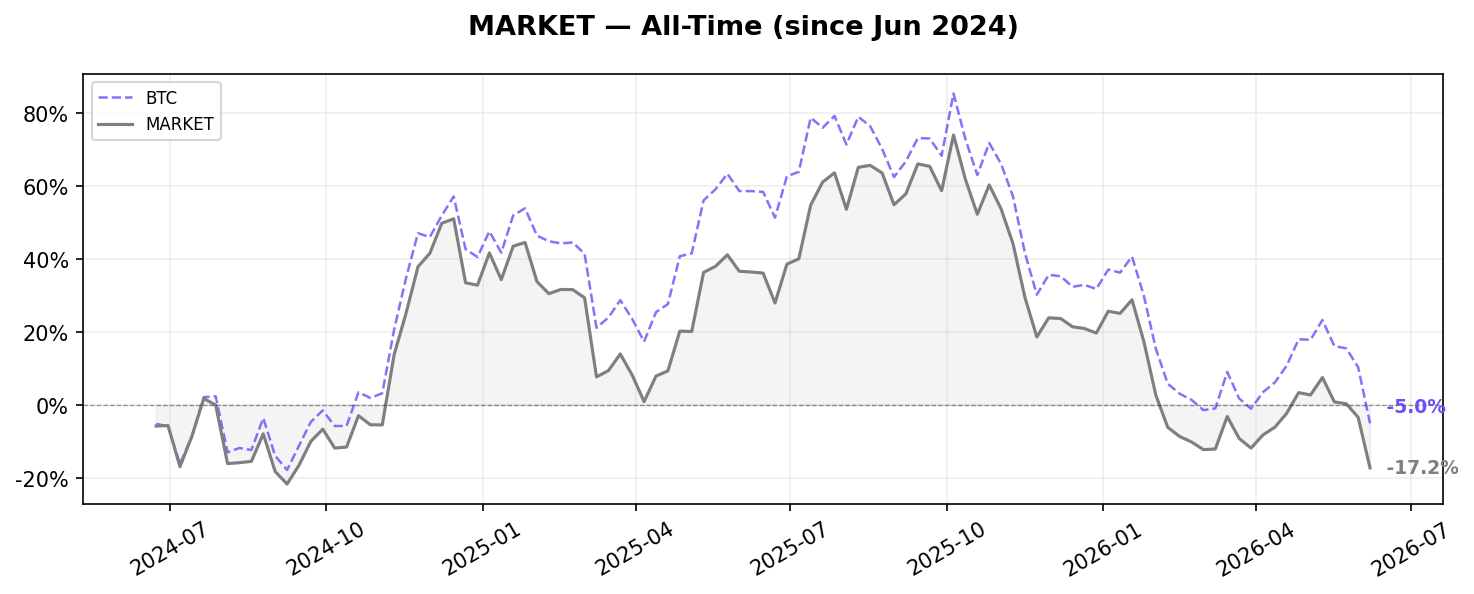
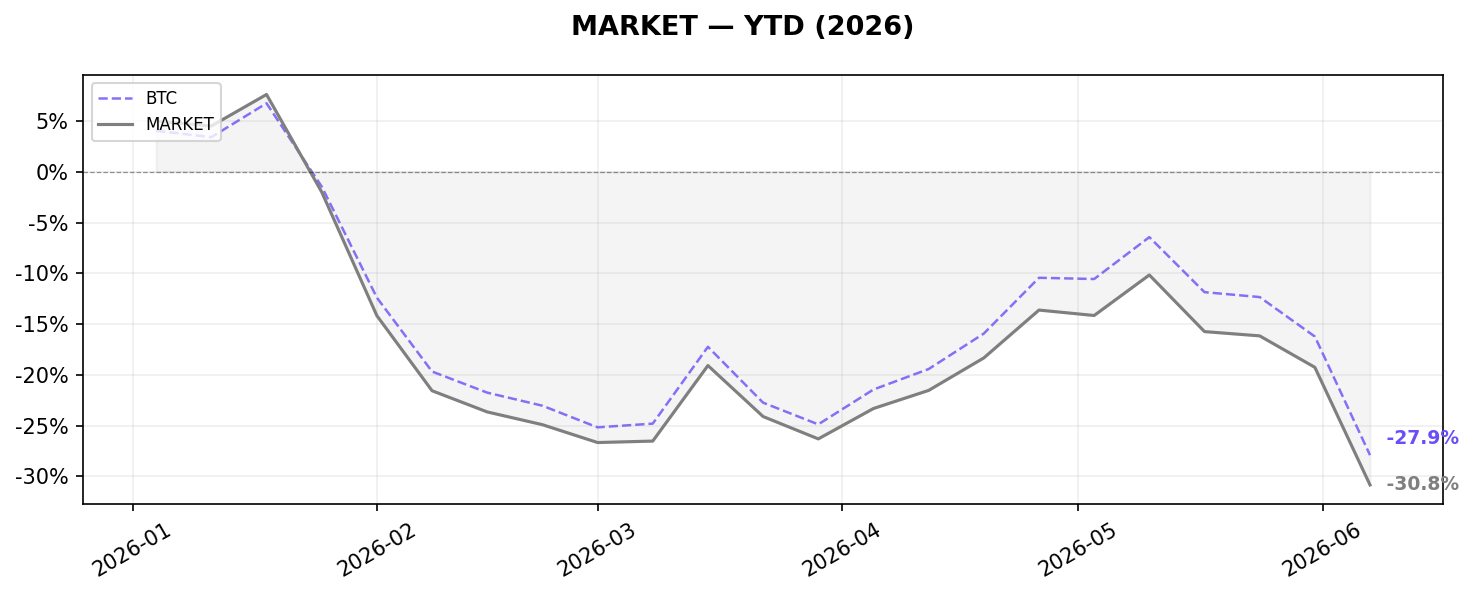
The Market Risk factor returned -6.53% in May, broadly in line with BTC’s decline. With BTC comprising ~76% of the portfolio, the strategy is effectively a leveraged bet on Bitcoin sentiment. ETH’s steeper -15.4% drop weighed on the remaining exposure, while small-weight holdings like HYPE (+69.5%) and ZEC (+59.8%) were too tiny to offset losses. The factor’s -30.85% YTD drawdown reflects the broader 2026 crypto bear phase, though the long-run annualized return of +10% since inception continues to reflect the market’s structural upward drift. Max drawdown of -52.4% since Jan 2022 is consistent with crypto’s historic peak-to-trough behavior.
Top 5 Winners & Losers for May
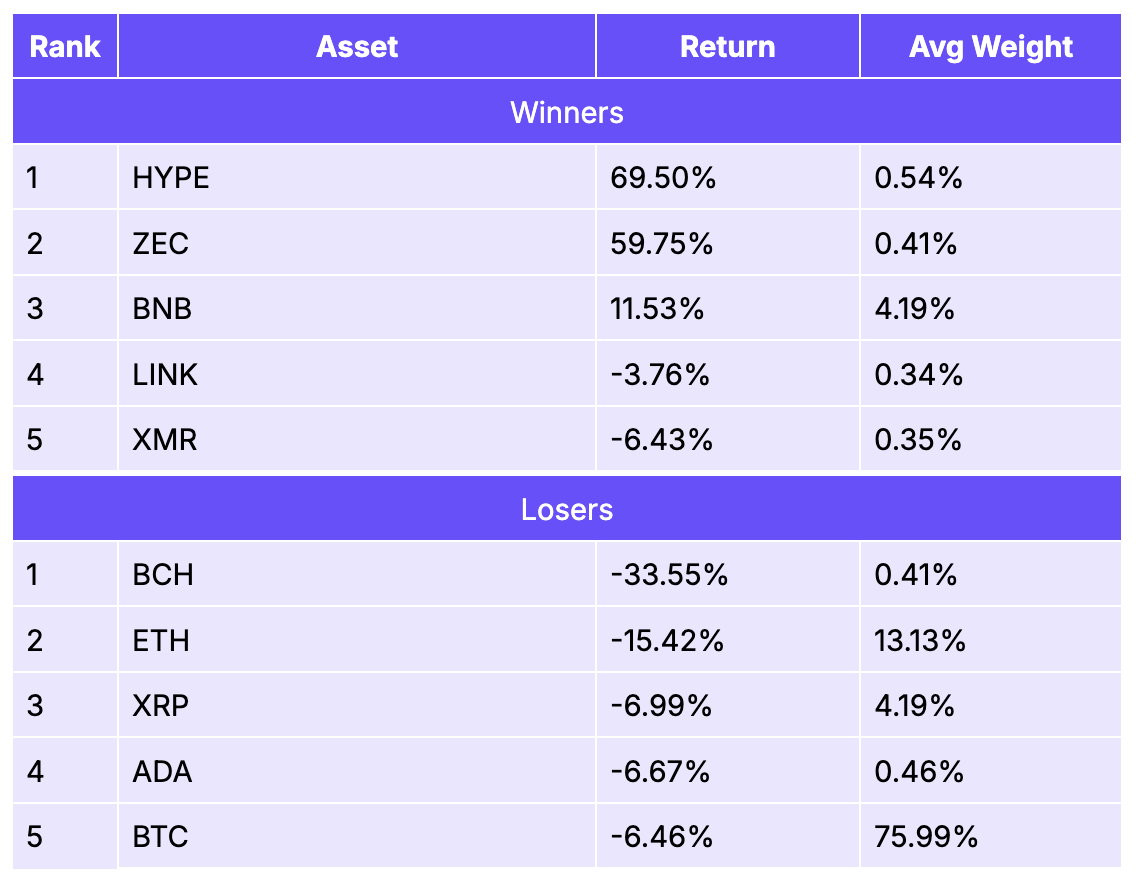
HYPE (+69.5%) and ZEC (+59.8%) were the portfolio’s top contributors in May, though their combined weight below 1% meant the impact on total return was minimal. BNB +11.5% at a 4.2% weight provided modest positive drag. The real story was the concentration risk: BTC (-6.5%) and ETH (-15.4%) together represent ~88% of the portfolio and both declined, while BCH fell 33.6%, an outsized move for a relatively illiquid holding. The winners/losers table highlights how, even in a down month, high-beta small-weight names can diverge dramatically from the overall portfolio trajectory.
Size Factor
Construction
Equal-weighted long-short factor: long the smallest 50% of eligible assets by market cap, short the largest 50%. Minimum 40 assets (20 per leg). Breakpoint: 50th percentile of market cap.
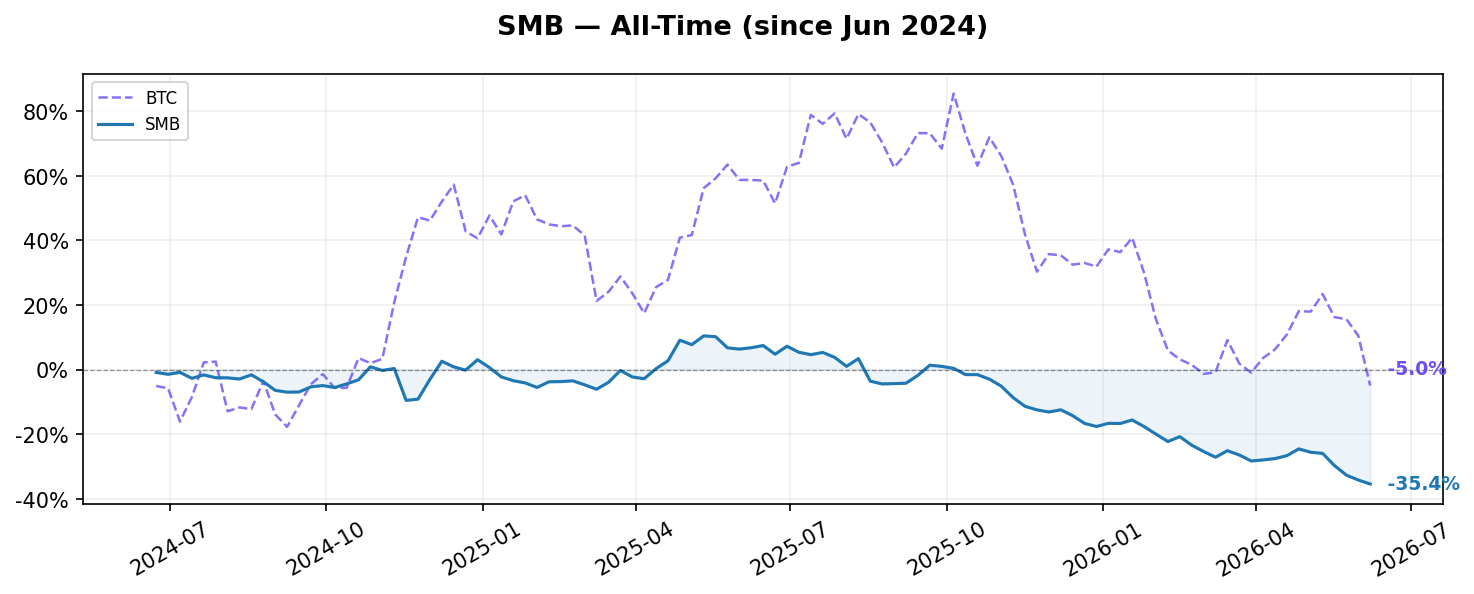
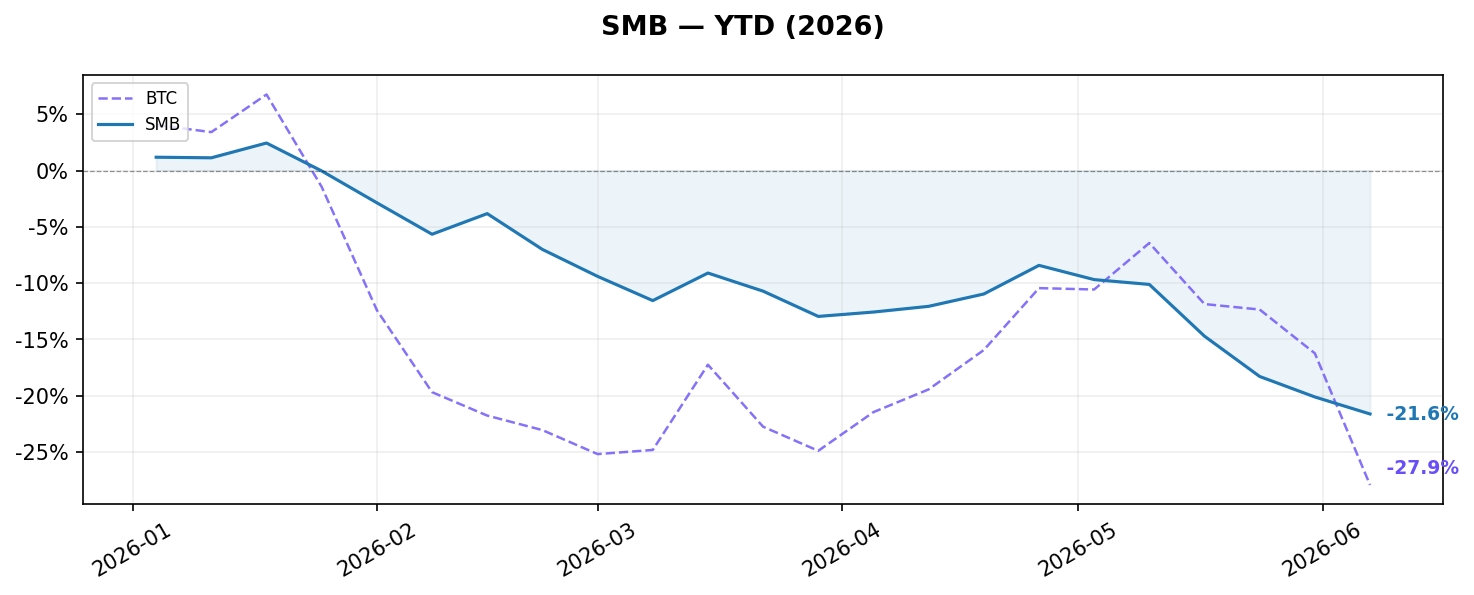
Performance Metrics
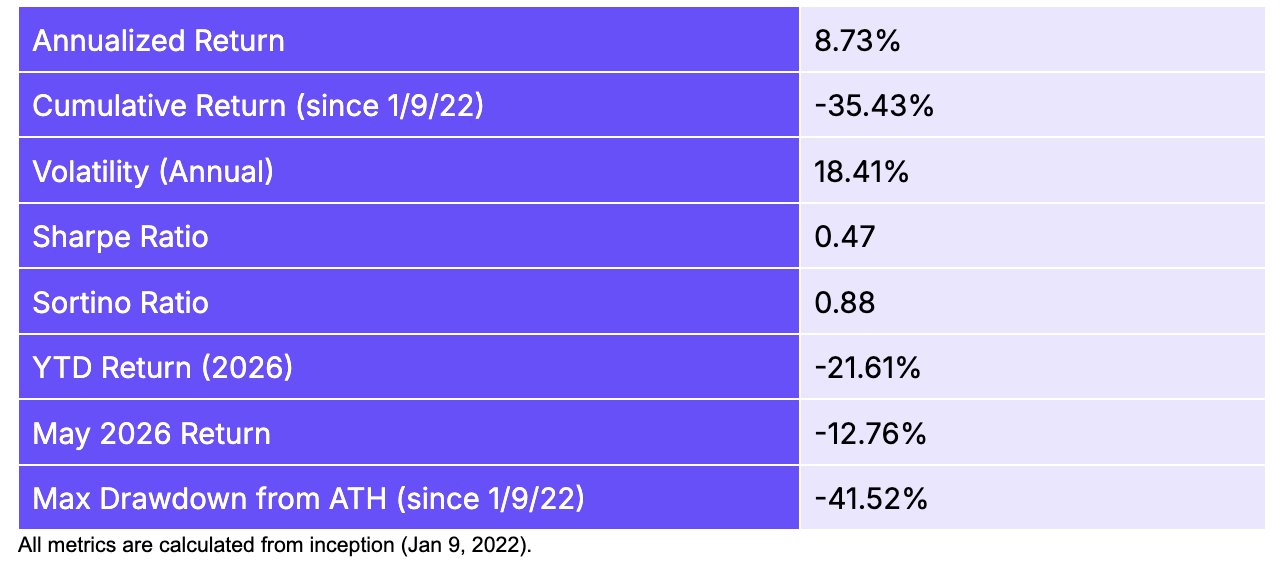
SMB delivered -12.76% in May, its worst month in 2026, as large-cap assets dramatically outperformed small caps. The factor shorts large caps and longs small caps, so HYPE (+69.5%), NEAR (+66.9%), and ZEC (+59.8%), all in the short (large-cap) leg, created severe losses that swamped gains on the long side. Structurally, this reflects a flight-to-quality dynamic common in bear markets: liquidity concentrates in the most well-known assets, punishing the small-cap long book. Despite May’s setback, the strategy’s annualized return of +8.7% and Sharpe of 0.47 since inception suggest the small-cap premium persists over time.
Top 5 Winners & Losers for May
INJ (+74.7%) and AKT (+61.1%) were the top contributors on the long (small-cap) side, reflecting strong token-specific catalysts. BCH shorting (+33.5%) also added value as that large-cap name sold off. The catastrophic losses came from the short book: HYPE (-69.5%) and NEAR (-66.9%) as shorts both surged, each carrying equal weight. The factor’s equal-weighting across 20+ names per leg means any outsized move in even one position has a material impact. The May episode underscores that SMB can experience large short-term reversals when market narratives sharply favor large-cap assets.
Value Factor
Construction
Equal-weighted long-short: long assets with the lowest Market Cap / Fees ratio (highest fundamental value), short assets with the highest MC / Fees ratio (most expensive). Minimum 30 assets (15 per leg).
Performance Metrics
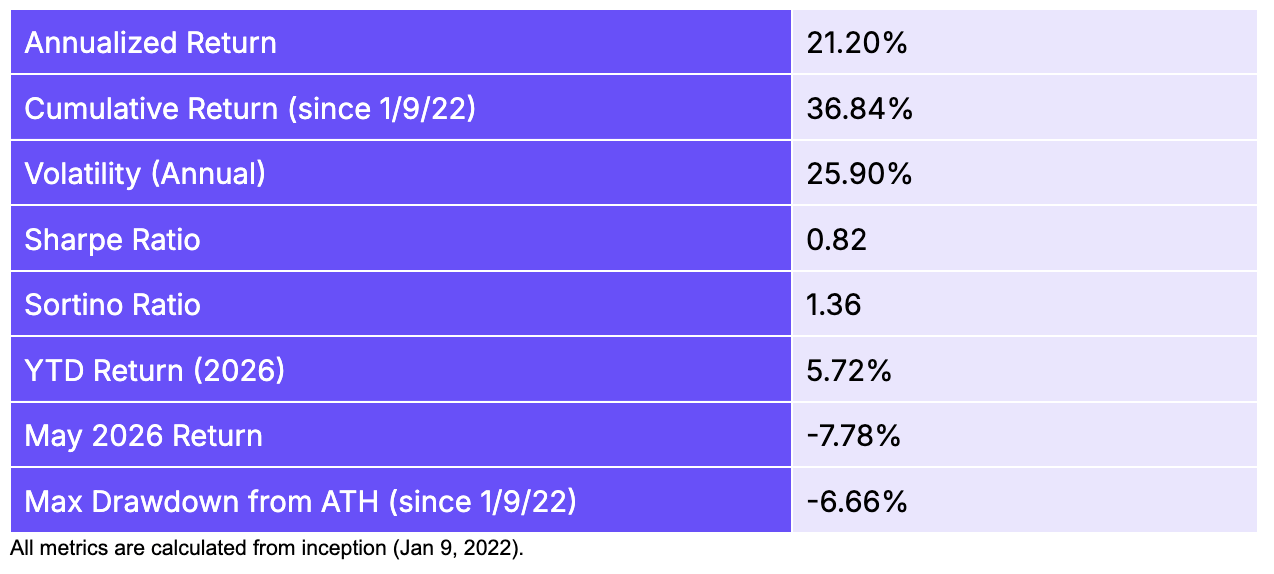
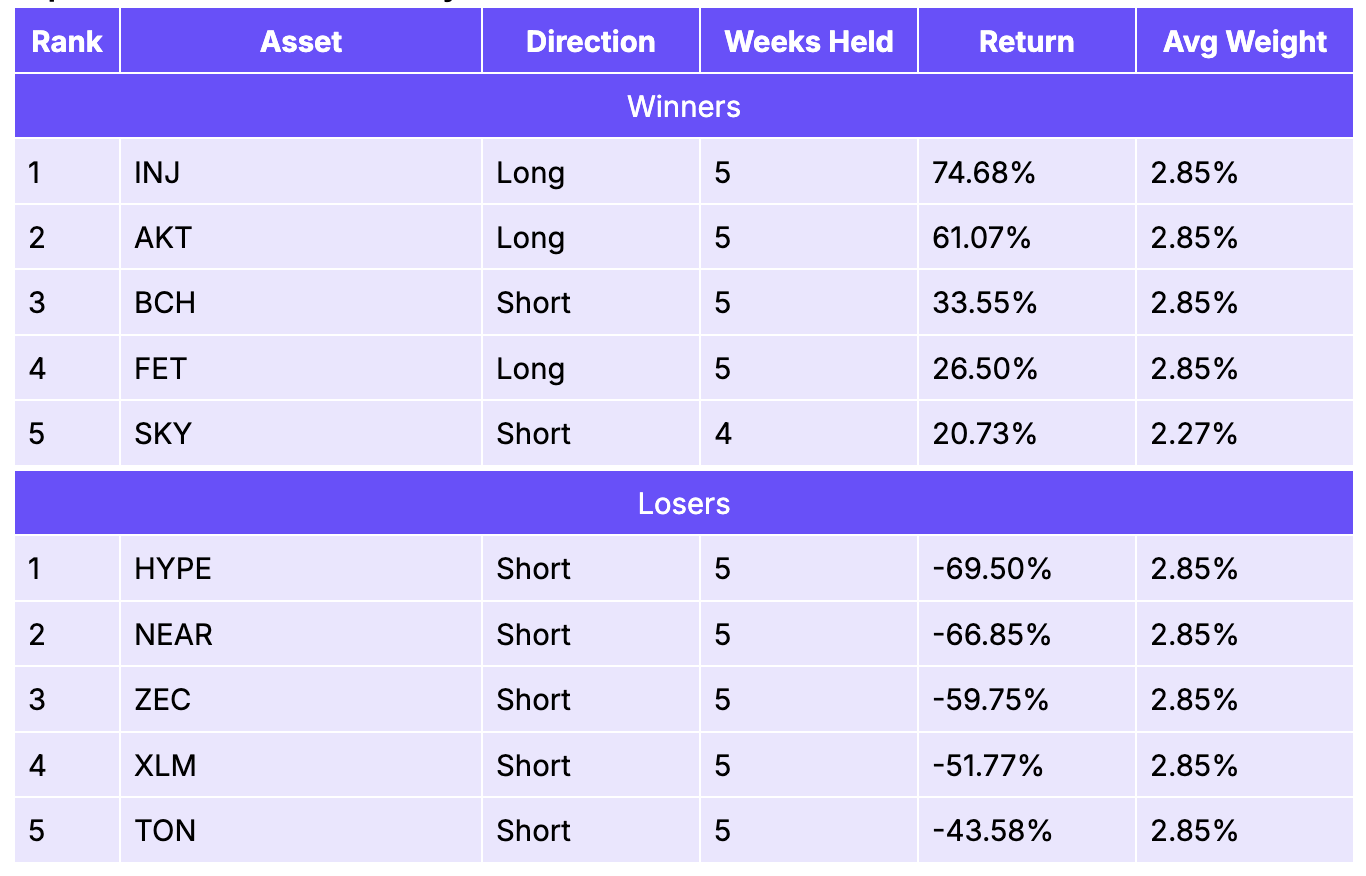
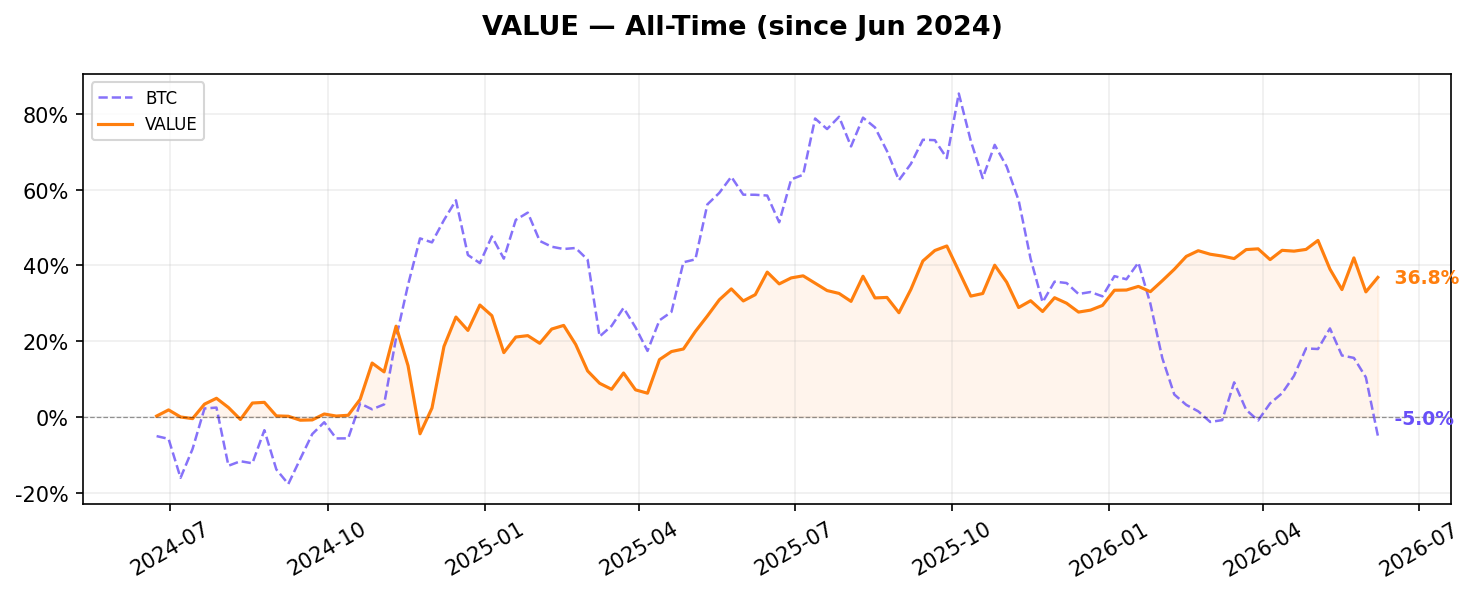
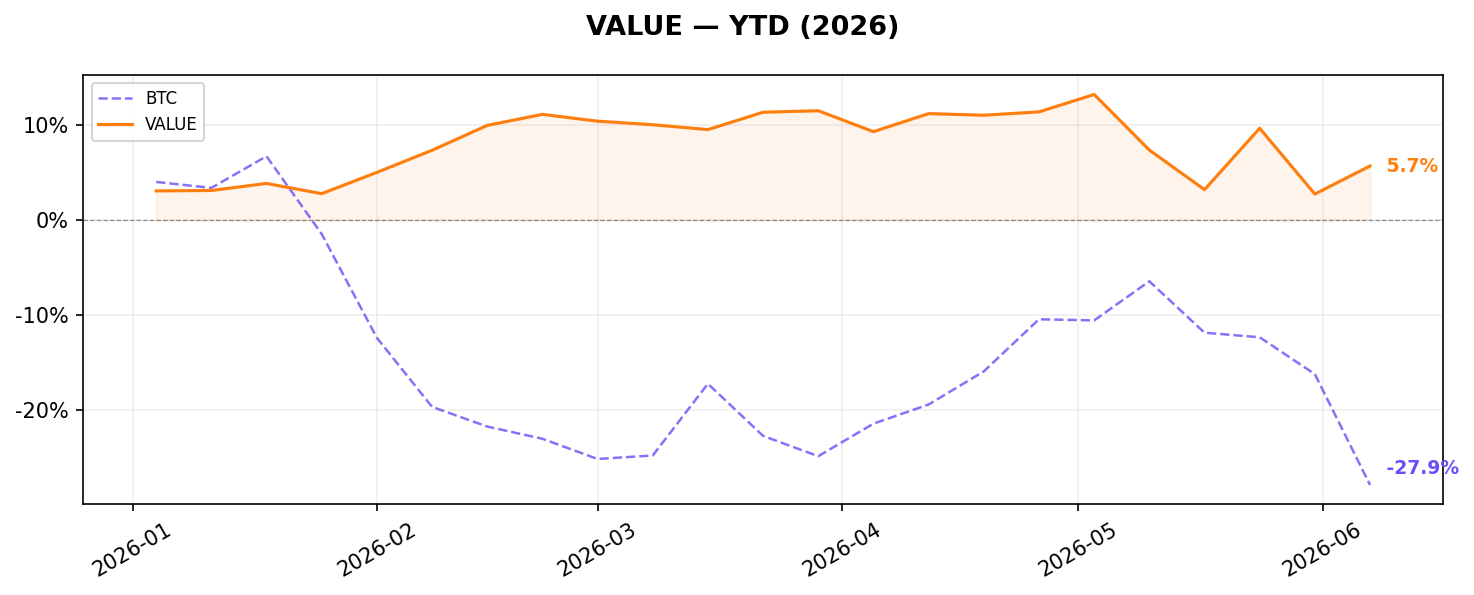
Value returned -7.78% in May as several high-value (low MC/fees) long positions underperformed while some low-value shorts rallied. The factor longs assets trading cheaply relative to fees generated and shorts expensive ones, a sensible long-run signal, but subject to momentum reversals. Notably, the YTD return is still positive at +5.72%, and the all-time cumulative return of +36.8% is the strongest of the price-based factors. The May drawdown reflects temporary mispricing as investors bid up high-MC/fees assets (e.g., XLM, TON) in anticipation of future fee growth rather than current fundamentals.
Top 5 Winners & Losers for May
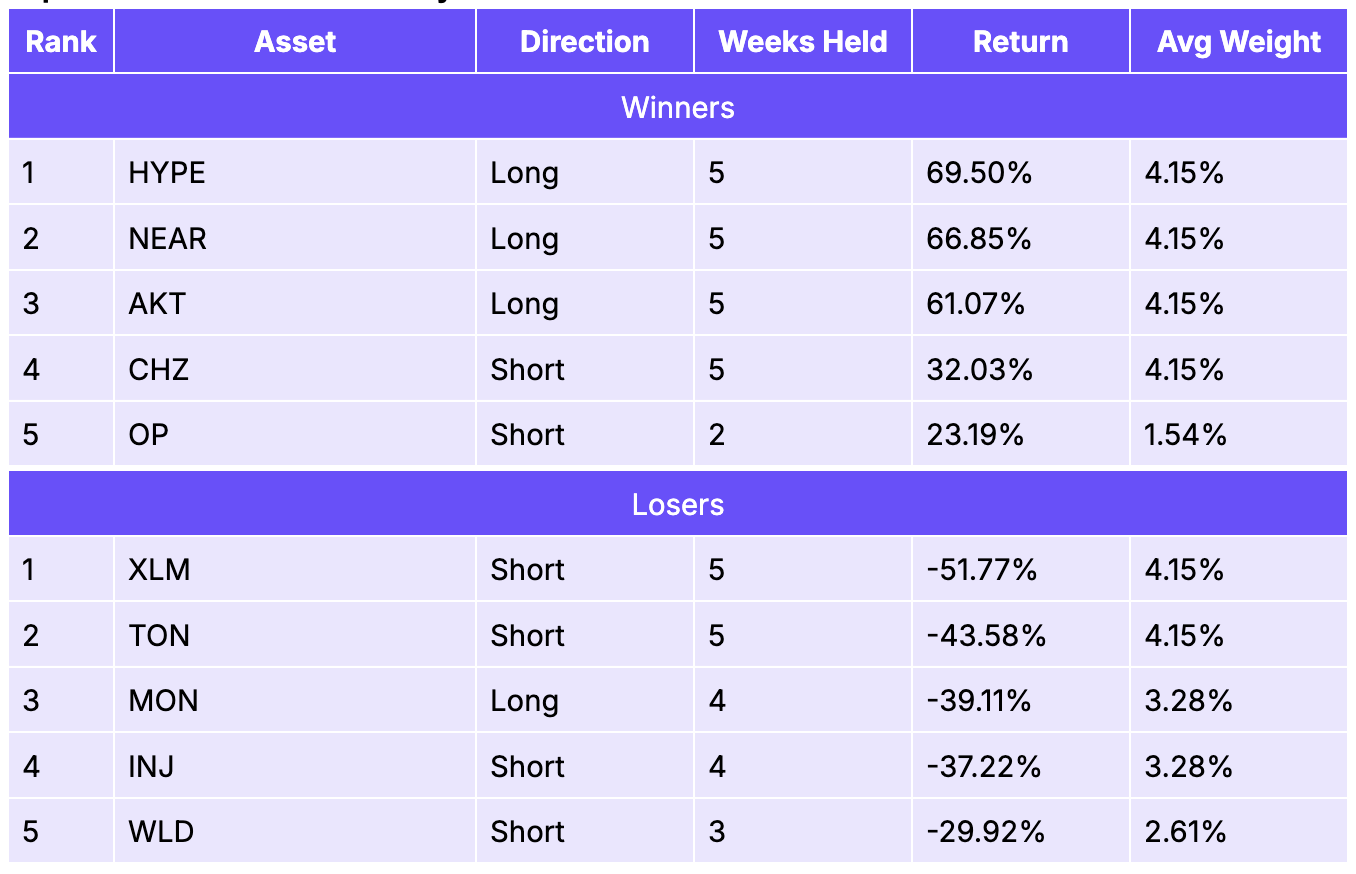
HYPE (+69.5%), NEAR (+66.9%), and AKT (+61.1%) powered the long book, confirming that some low-MC/fees assets delivered exceptional returns. CHZ (+32.0%) and OP (+23.2%) shorts worked as expected. The main drag was the short book’s reversal: XLM (-51.8%) and TON (-43.6%) were shorted as expensive assets but rallied hard, a reminder that sentiment can override fundamentals in the short run. MON long (-39.1%) and INJ short (-37.2%) also hurt, the latter particularly frustrating given INJ’s strong momentum simultaneously benefiting the Momentum factor.
Momentum Factor
Construction
Volatility-adjusted momentum: calculates 3-week rolling Sharpe-like score (mean return / std dev of daily return) for each asset. Long top 25% by filtered momentum, short bottom 25%. Equal-weighted, minimum 30 assets (15 per leg).
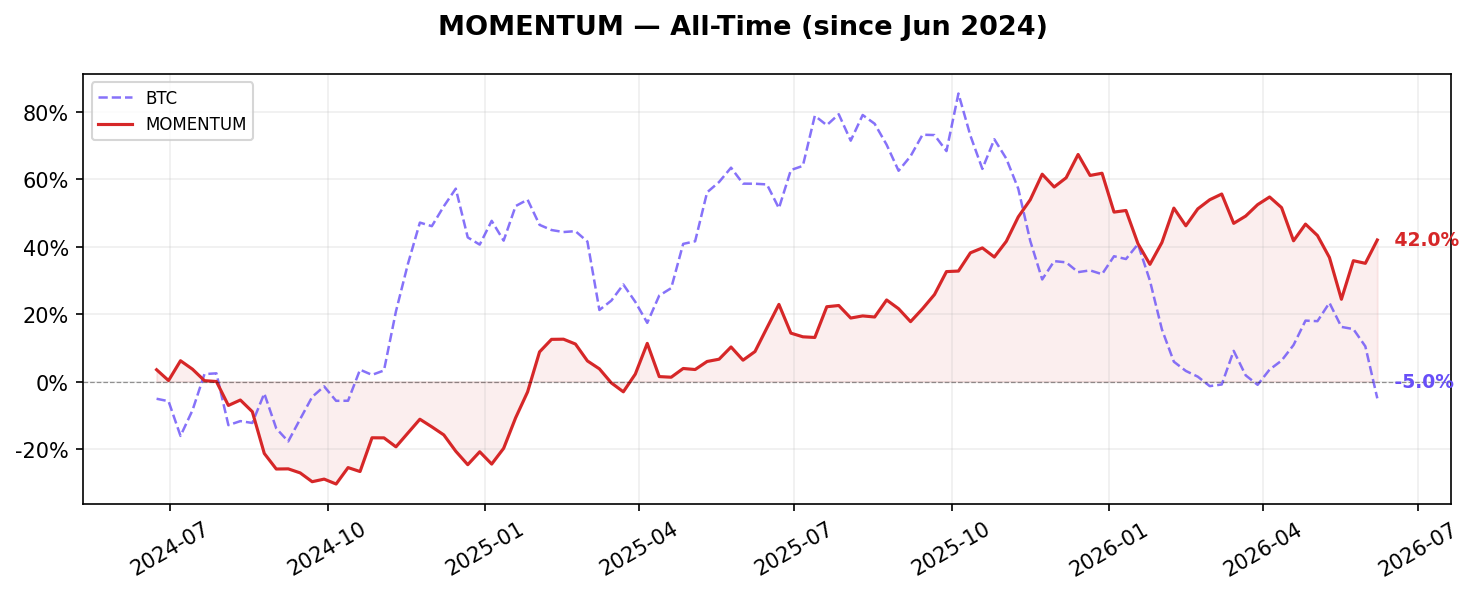
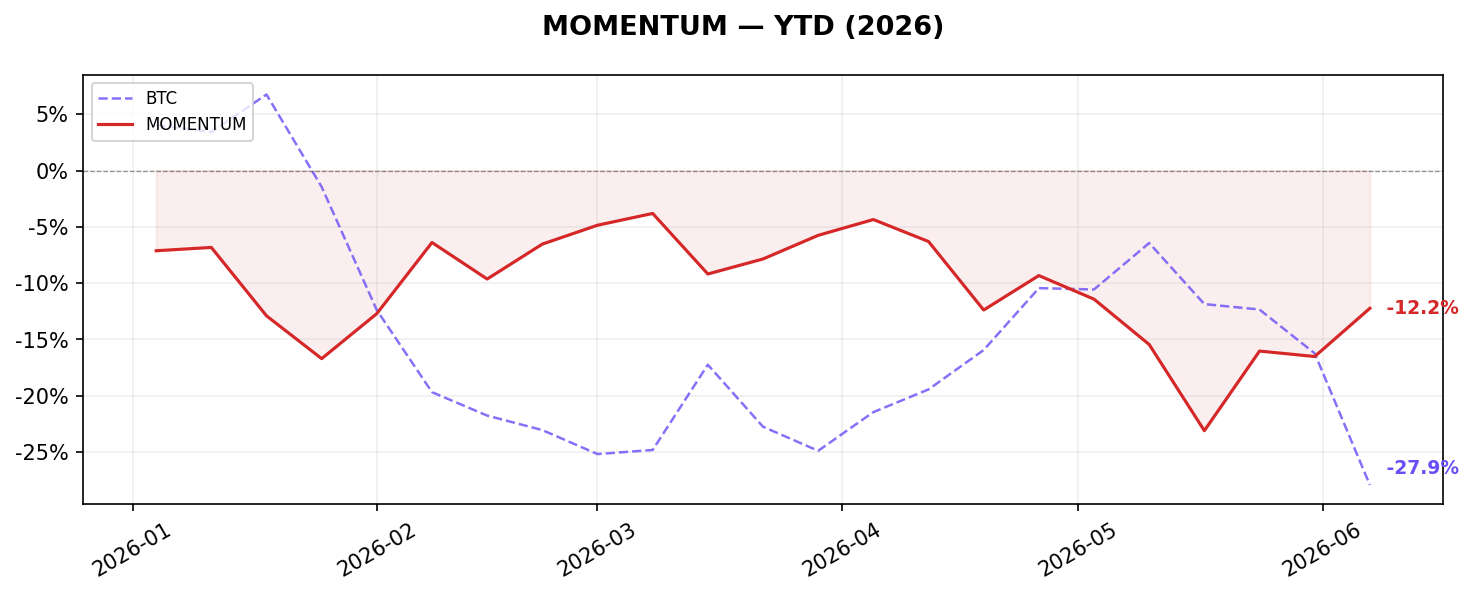
Performance Metrics

Momentum returned -7.93% in May as trend reversals hit both the long and short books. The strategy builds positions based on recent 3-week Sharpe-adjusted returns, making it vulnerable when markets abruptly change direction. INJ (+74.7%) was a standout long position that sustained its trend, but XLM reversed dramatically from the short book, surging 53% to become the factor’s biggest single detractor. At a YTD return of -12.23%, Momentum has given back gains from a strong 2025. Over the full period, however, it remains the second-best-performing factor at +50.2% annualized and Sharpe of 1.29.
Top 5 Winners & Losers for May
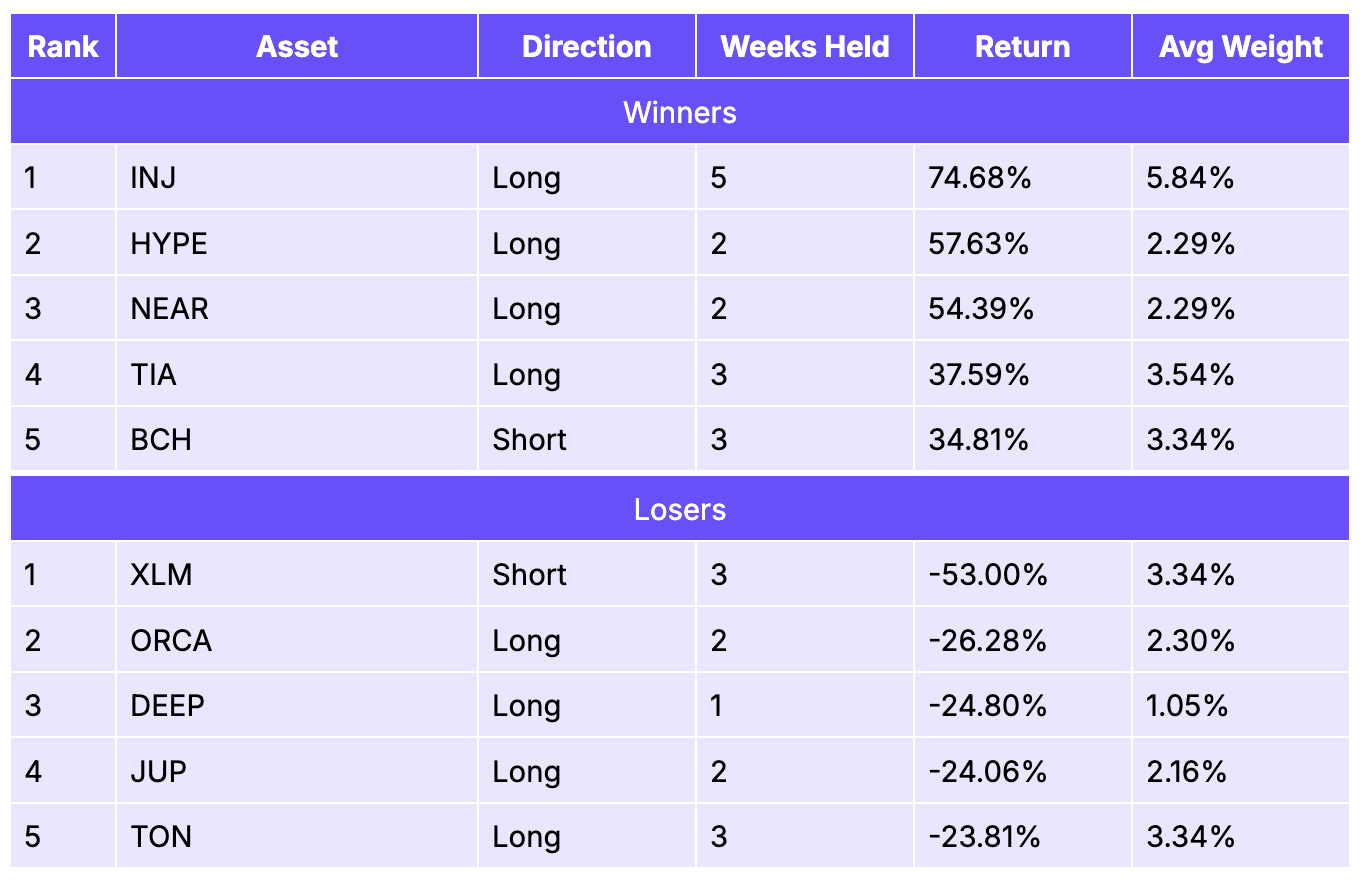
INJ’s +74.7% return as a sustained long position was the standout, carrying 5.8% average weight and driving meaningful positive contribution. HYPE (+57.6%) and NEAR (+54.4%) as short-lived momentum entries also added value. On the other side, XLM’s -53.0% surge from a short position was the single largest detractor: the asset had been flagged as a negative-momentum name but reversed sharply. ORCA (-26.3%), DEEP (-24.8%), and JUP (-24.1%) as long positions that faltered further compounded losses, suggesting momentum in mid-cap DeFi names broke down mid-month.
Growth
Construction
Equal-weighted long-short: composite score combining z-scores of 2-week trailing fee growth (pct change) and DAU growth (pct change). Long top 50% composite score, short bottom 50%. Eligibility requires DAU > 100 and weekly fees > $500. 30 assets (15 per leg).
Performance Metrics
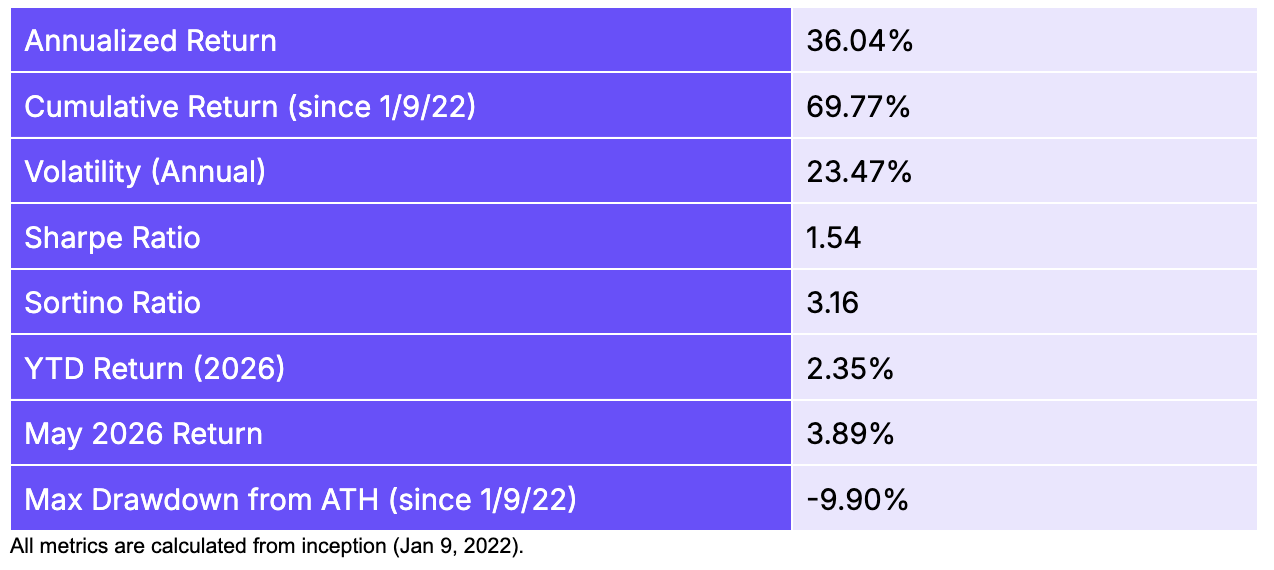
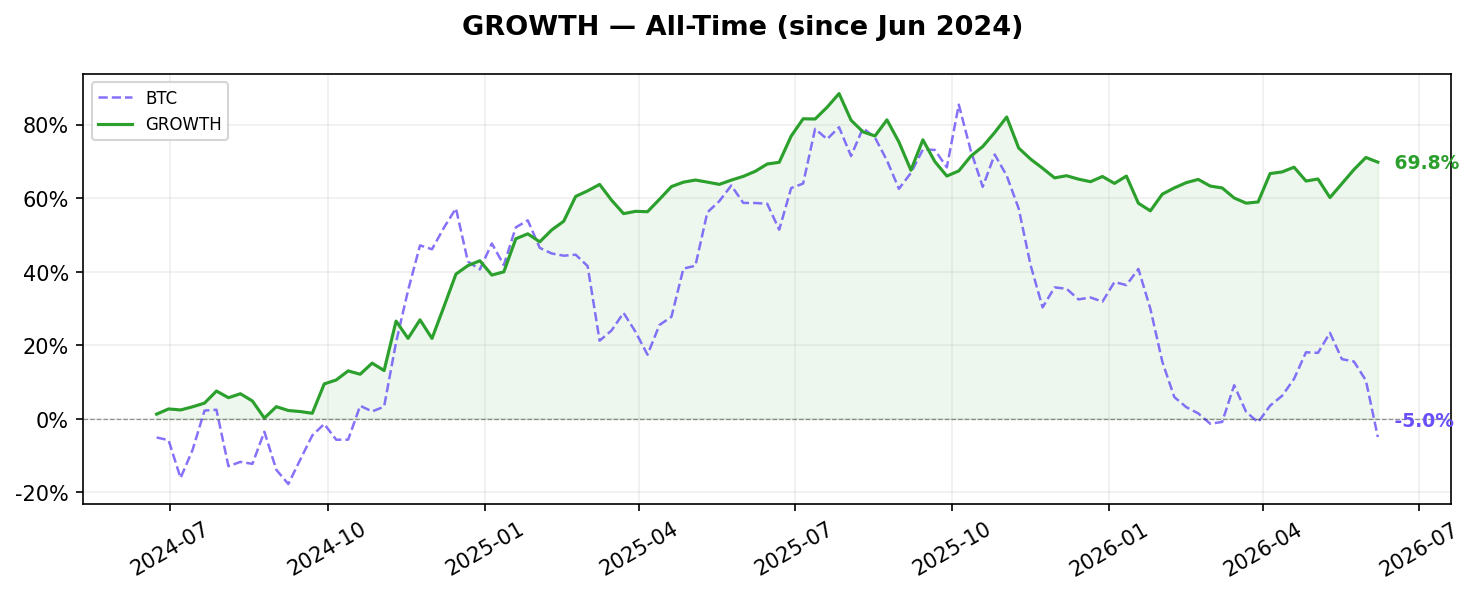
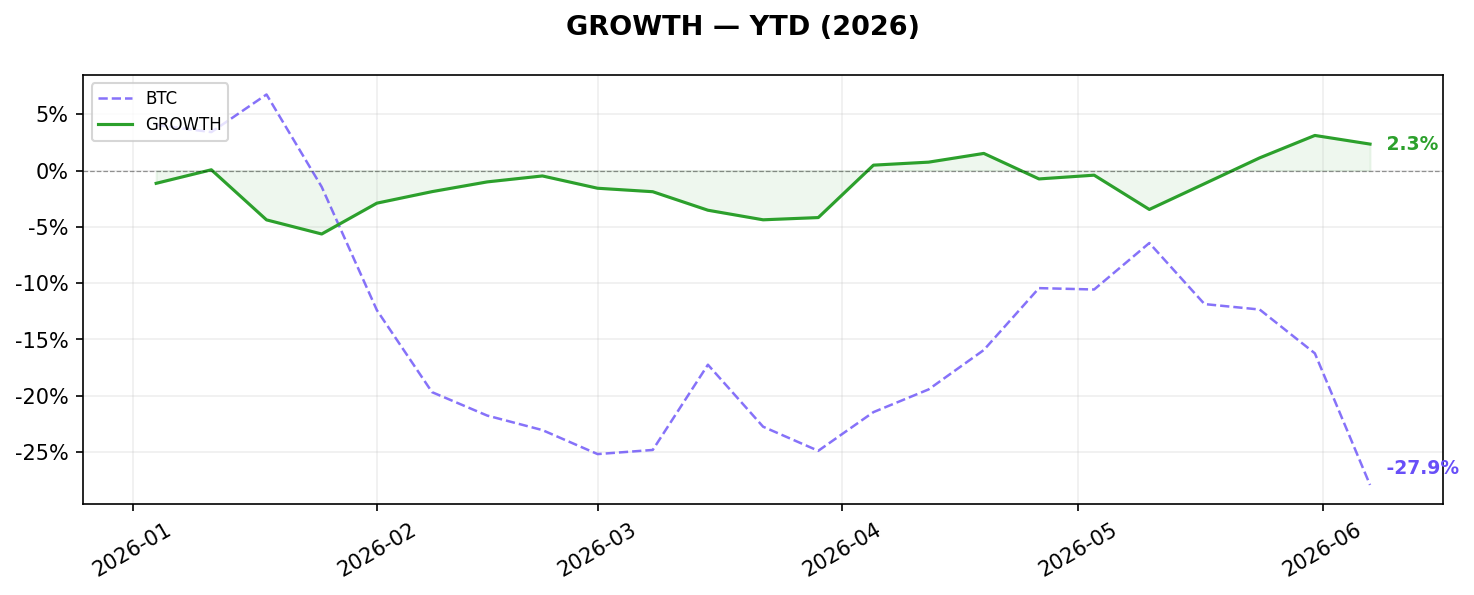
Growth was one of only two positive factors in May, returning +3.89%. The strategy longs assets with accelerating fee and DAU growth and shorts decelerating ones, a signal that proved prescient in May’s selective environment. HYPE and XLM both featured as longs with genuine on-chain activity expansion, while the short book correctly identified slowing growth in ARB, BONK, and ZRO. The +2.35% YTD return and annualized +36.0% return with a Sortino of 3.16 make Growth one of the more risk-efficient factors in the suite.
Top 5 Winners & Losers for May
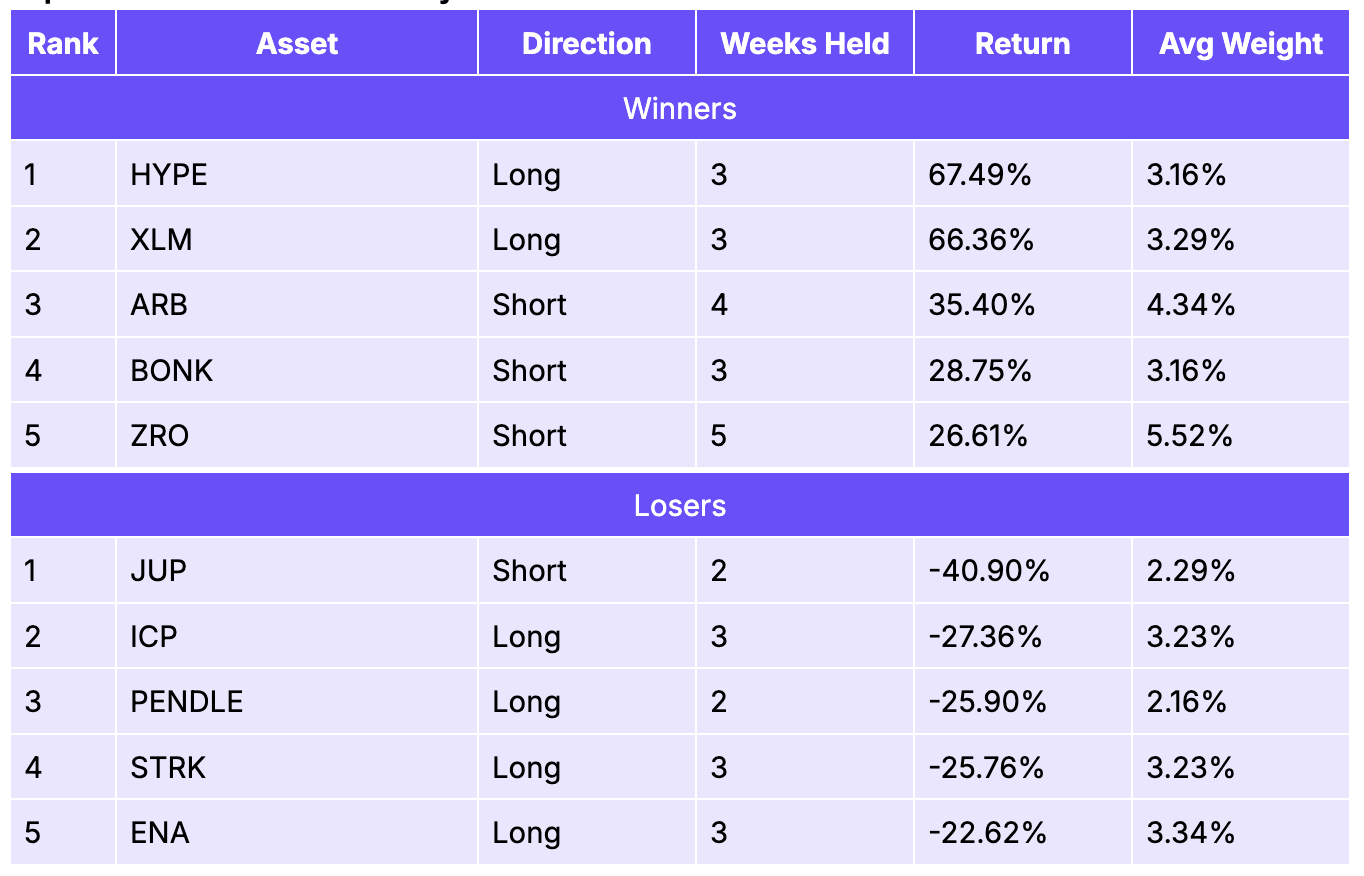
HYPE (+67.5%) and XLM (+66.4%) drove outsized gains on the long side, with both assets showing strong DAU and fee growth ahead of their price moves. ARB short (+35.4%), BONK short (+28.8%), and ZRO short (+26.6%) confirmed the factor’s identification of decelerating growth protocols. The losses came from JUP short (-40.9%), JUP’s activity growth re-accelerated unexpectedly, causing the short to lose significantly. ICP long (-27.4%), PENDLE (-25.9%), and STRK (-25.8%) also disappointed, with on-chain activity failing to translate into price outperformance in a broadly weak market.
Fundamentals 1
Construction
Equal-weighted long-short quintile portfolio: composite score combining rank z-scores of DAU growth, inverted active revenue share, revenue stability, and MC/fees mean reversion. Long top quintile (~12 assets), short bottom quintile (~12 assets).
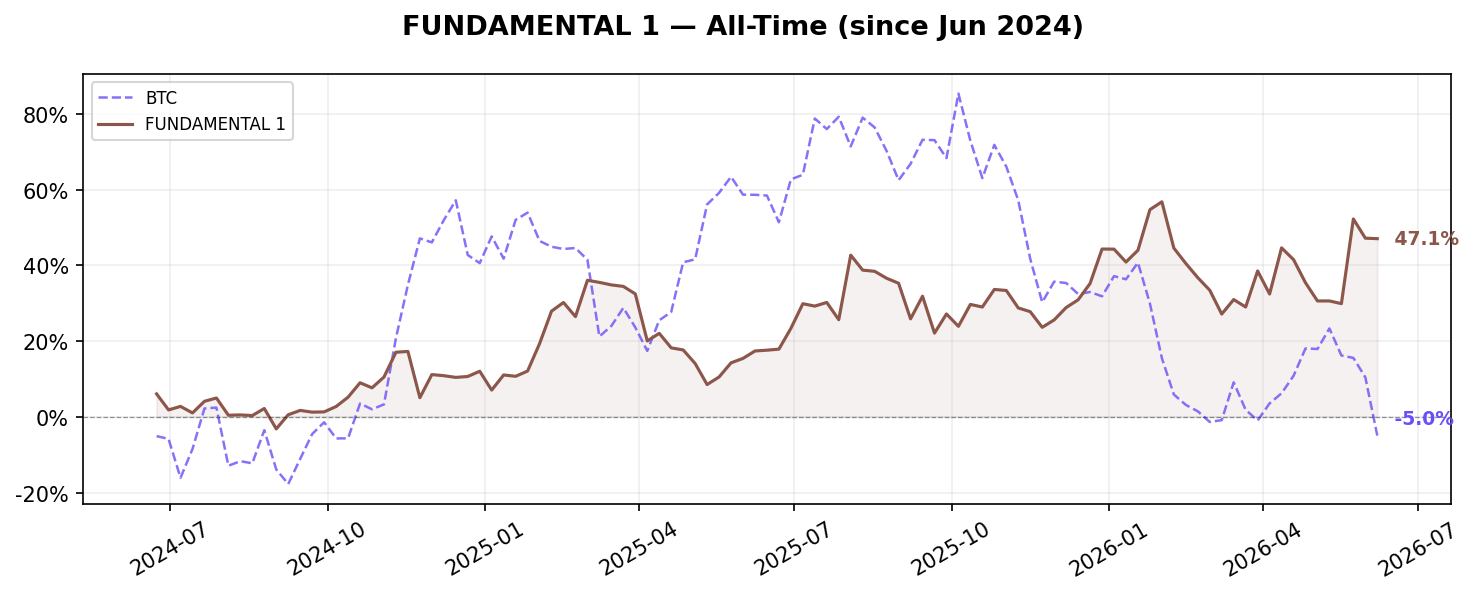
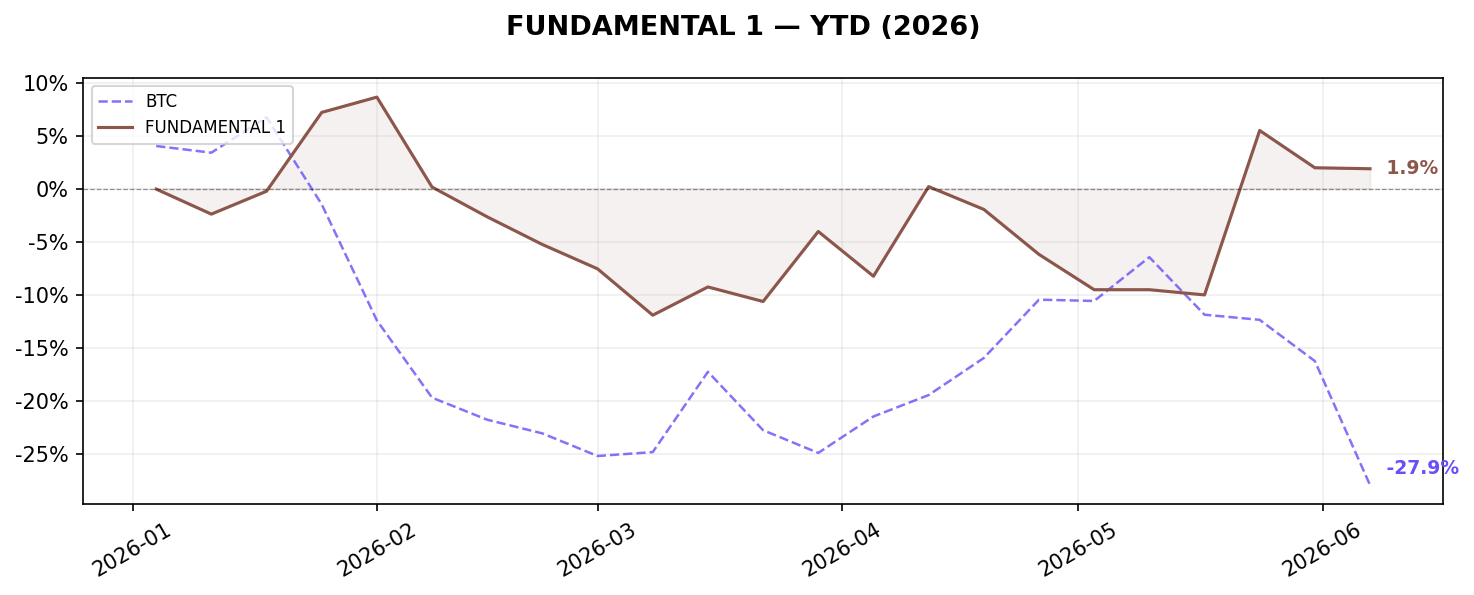
Performance Metrics
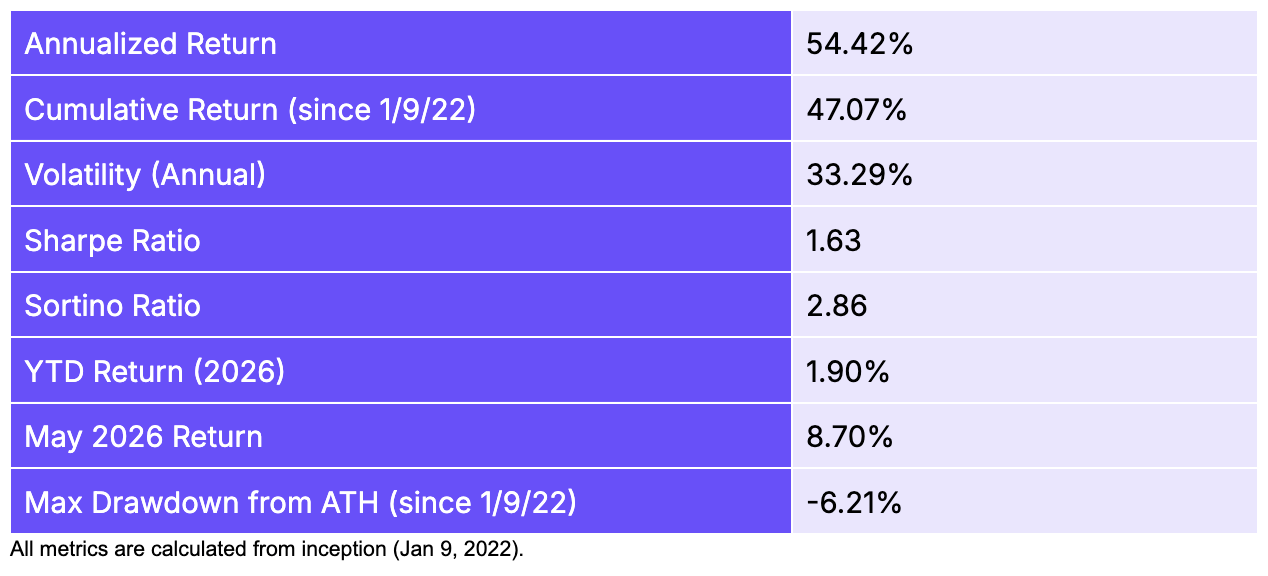
Fundamental 1 was the top-performing factor in May at +8.70%, its best monthly return in 2026. The strategy’s composite signal, combining DAU growth, revenue quality, stability, and MC/fees mean-reversion, correctly identified assets with improving on-chain health. XLM’s positioning as a long based on MC/fees mean-reversion generated exceptional returns. The factor’s small universe (as few as 3 assets per leg in May) creates high concentration risk, which in this case worked in its favor. The annualized return of +54.4% and Sharpe of 1.63 remain the best in the factor suite since inception.
Top 5 Winners & Losers for May
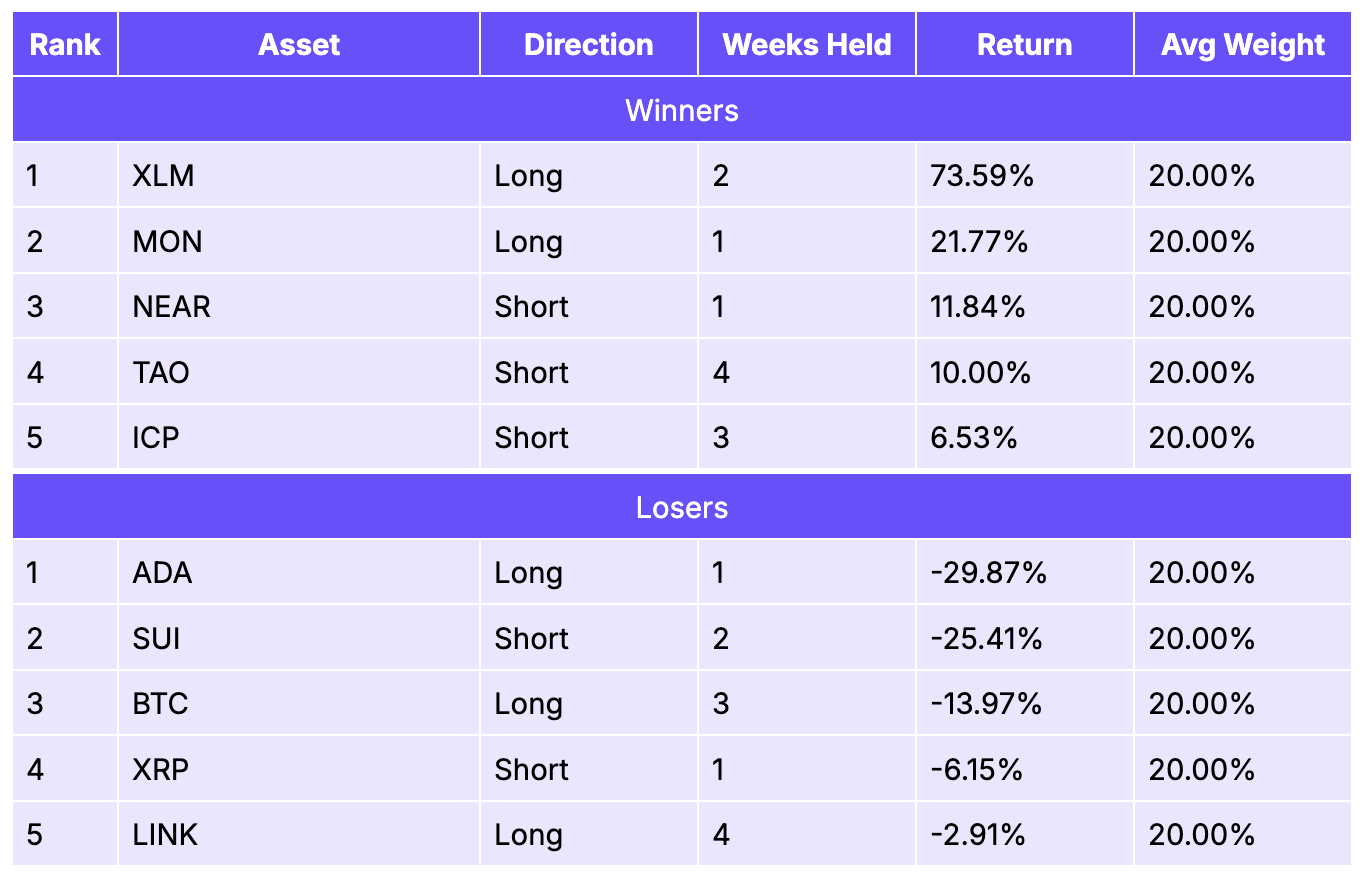
XLM’s +73.6% return over two weeks as the top long position was the dominant driver; the asset scored highly on MC/fees mean-reversion as its ratio had compressed relative to its historical average. MON (+21.8%) also contributed positively as a one-week long. On the short side, NEAR (+11.8%), TAO (+10.0%), and ICP (+6.5%) all declined as expected. The main detractors were ADA long (-29.9%), where the signal misfired despite strong metrics, and SUI short (-25.4%) which rallied against the factor’s positioning. The small universe means each position carries 20% weight, amplifying both gains and losses.
Stablecoins 1
Construction
Equal-weighted long-short quintile portfolio: composite score combining rank z-scores of stablecoins flow. Long top quintile (~3-4 chains), short bottom quintile (~3-4 chains).
Performance Metrics
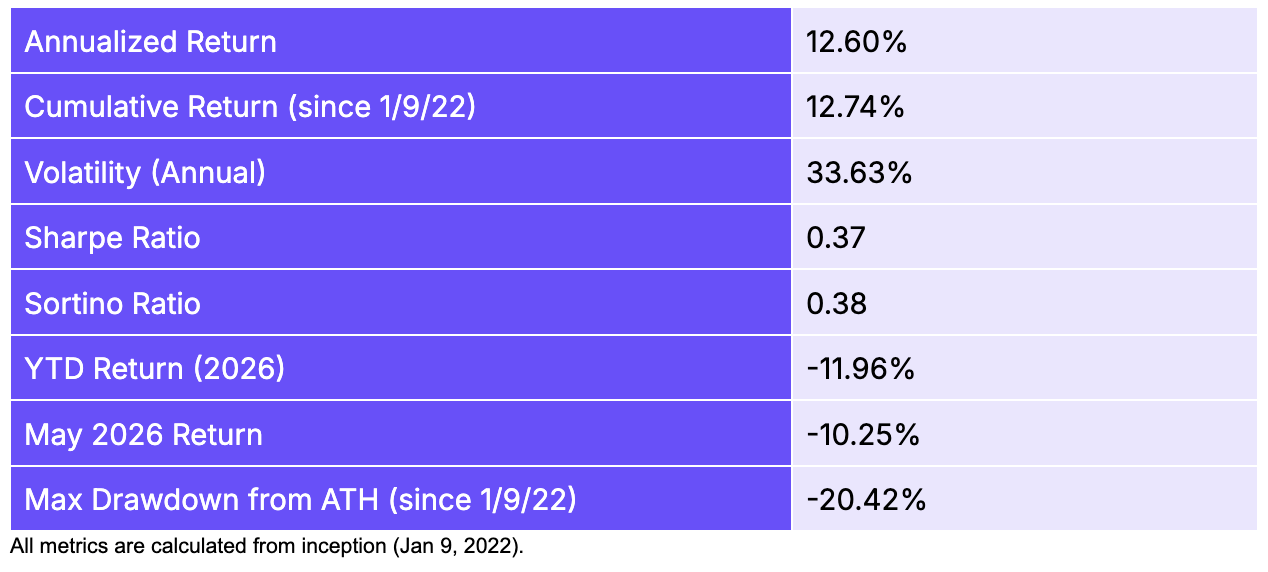
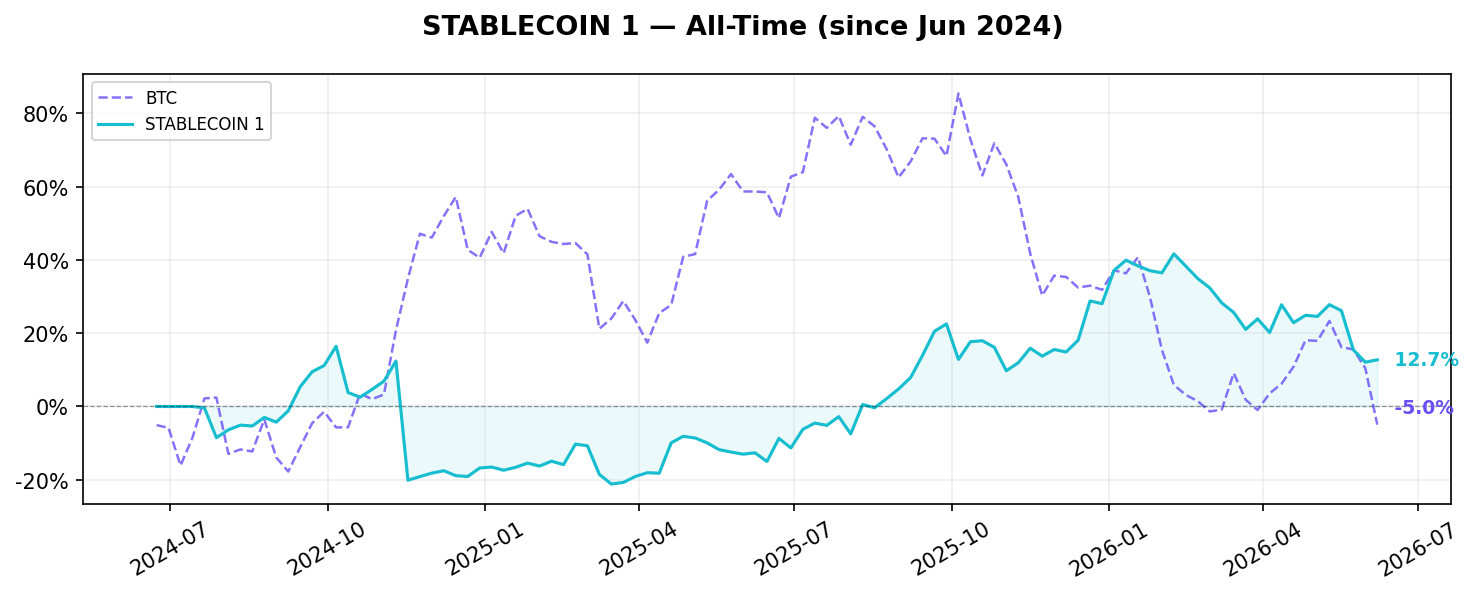
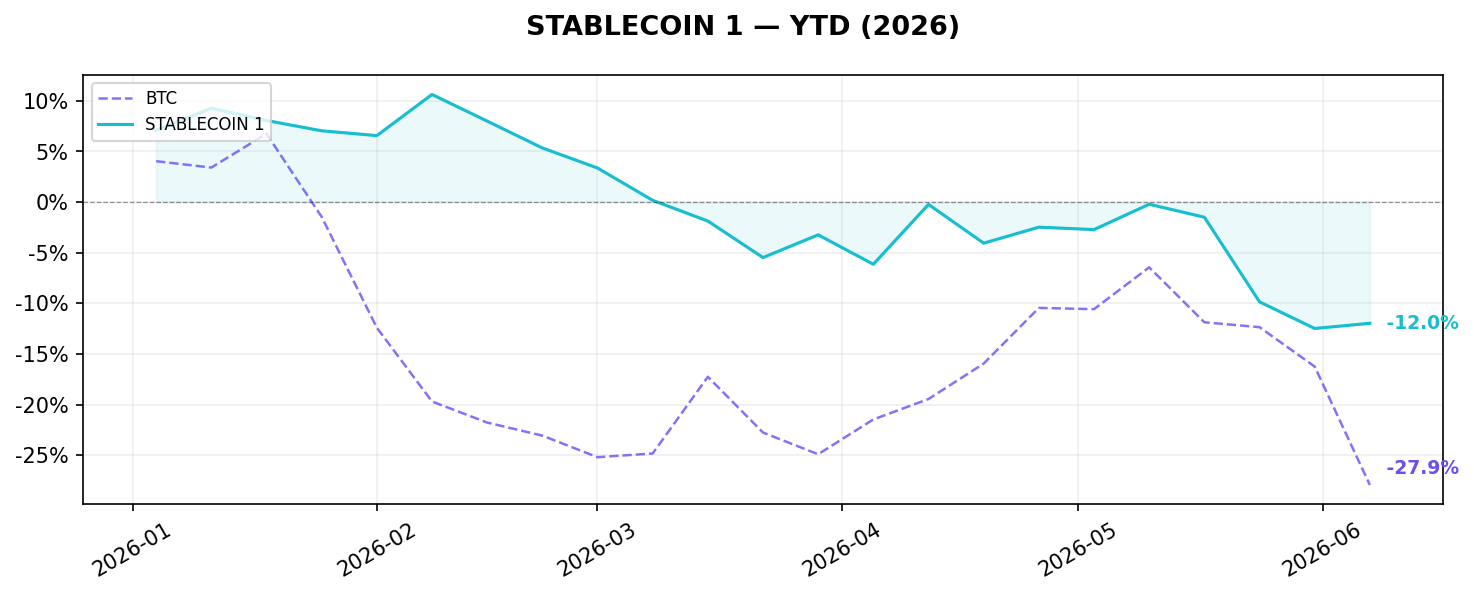
Stablecoin 1 returned -10.25% in May, its second consecutive negative month, bringing YTD losses to -11.96%. The factor tracks stablecoin inflows and outflows across chains, longing chains with net inflows (bullish signal) and shorting those with outflows. In May, the signal misfired as chains with expected outflows (SEI, APT) instead saw their native tokens rally. The annualized return of +12.6% and Sharpe of 0.37 reflect that this factor captures a real signal but with higher noise than the on-chain fundamental strategies. It also has the shortest track record in the suite at ~2 years.
Top 5 Winners & Losers for May
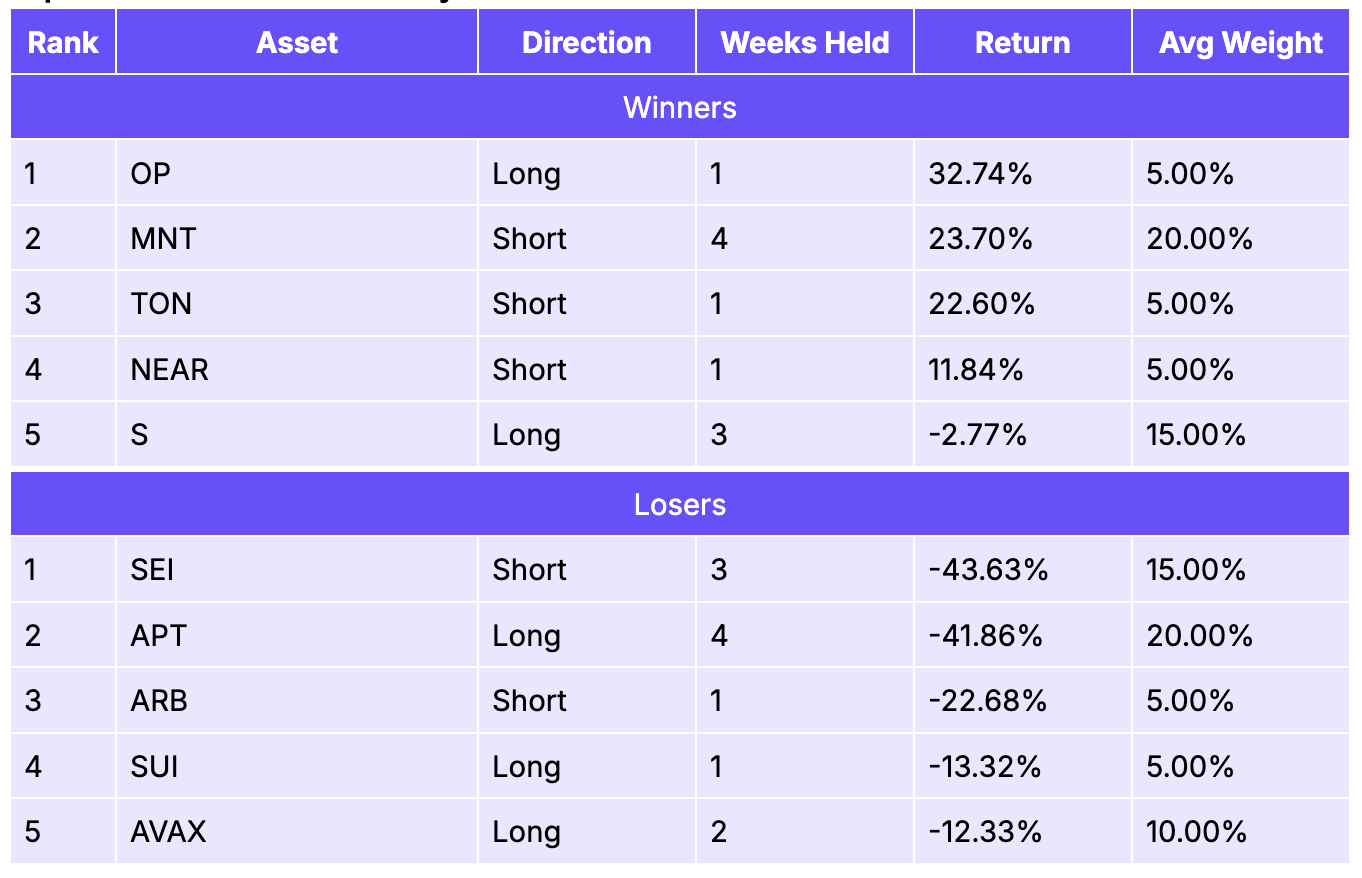
OP long (+32.7%) and MNT short (+23.7%) were the top contributors; both chains showed clear stablecoin flow dynamics that the signal correctly anticipated. TON short (+22.6%) and NEAR short (+11.8%) also contributed positively. The severe losses came from SEI short (-43.6%) and APT long (-41.9%): SEI experienced a native token rally despite stablecoin outflows, and APT’s stablecoin inflows failed to support its token price. ARB short (-22.7%) and SUI long (-13.3%) further compounded the negative return, suggesting stablecoin flow as a standalone signal had low predictive power for native token returns in May’s choppy environment.
Key Findings & Conclusion
May 2026 reinforced two durable lessons about systematic factor investing in crypto. First, on-chain activity metrics are more resilient than price-based signals in a risk-off environment. Growth and Fundamental 1 were the only two positive factors in May precisely because they measure what protocols are actually doing, not where their tokens have been trading. The remaining five factors, which rely on price, volume, or capital flows, all declined in a month when sentiment shifted faster than fundamentals. Second, single-name concentration risk is amplified in crypto’s thin market structure. XLM’s roughly 52% surge in May simultaneously drove the best returns in Fundamental 1 and Growth while punishing Value and Momentum shorts, illustrating how one asset can swing the outcome of multiple strategies at once. Looking across the full track record, the three highest-Sharpe factors (Fundamental 1 at 1.63, Growth at 1.54, and Momentum at 1.29) have all weathered periods like this before and continued compounding. The case for running a diversified multi-factor portfolio is exactly that no single month, and no single narrative, moves all seven strategies in the same direction.
If you have any questions, feel free to reach out to team@artemis.xyz or shoot us a DM on X.com at https://x.com/artemis