
Artemis Crypto Factor Model Analysis: May 2026 Update
An update on how beta, size, value, momentum, fundamentals, and stablecoins systematically drove crypto returns over the past month.

Executive Summary
April marked a sharp reversal from the Q1 risk-off regime. The crypto market factor rallied +17.2%, led by BTC (+19.2%) and ETH (+19.5%), as the broader macro backdrop shifted toward optimism on Middle East conflict resolution and a powerful AI-driven rally in equities.
Long-short factors posted muted but mostly positive returns as expected during a broad recovery. Value (+1.7%), Momentum (+0.9%), and Growth (+1.1%) all generated positive alpha, though the short legs were squeezed as previously oversold tokens snapped back. Fundamentals 1 was the only negative factor (-3.7%), driven primarily by PENDLE‘s sharp rally against its short positioning.
Cross-factor themes included the DAO governance narrative (DEXE as a top contributor in both SMB and Momentum for the second consecutive month), explosive privacy coin demand (ZEC rallying 50%+ on SEC clearance and Grayscale’s first-ever privacy coin ETF filing), and a DeFi yield recovery led by PENDLE‘s sPENDLE tokenomics overhaul and Aerodrome‘s cross-chain expansion plans.
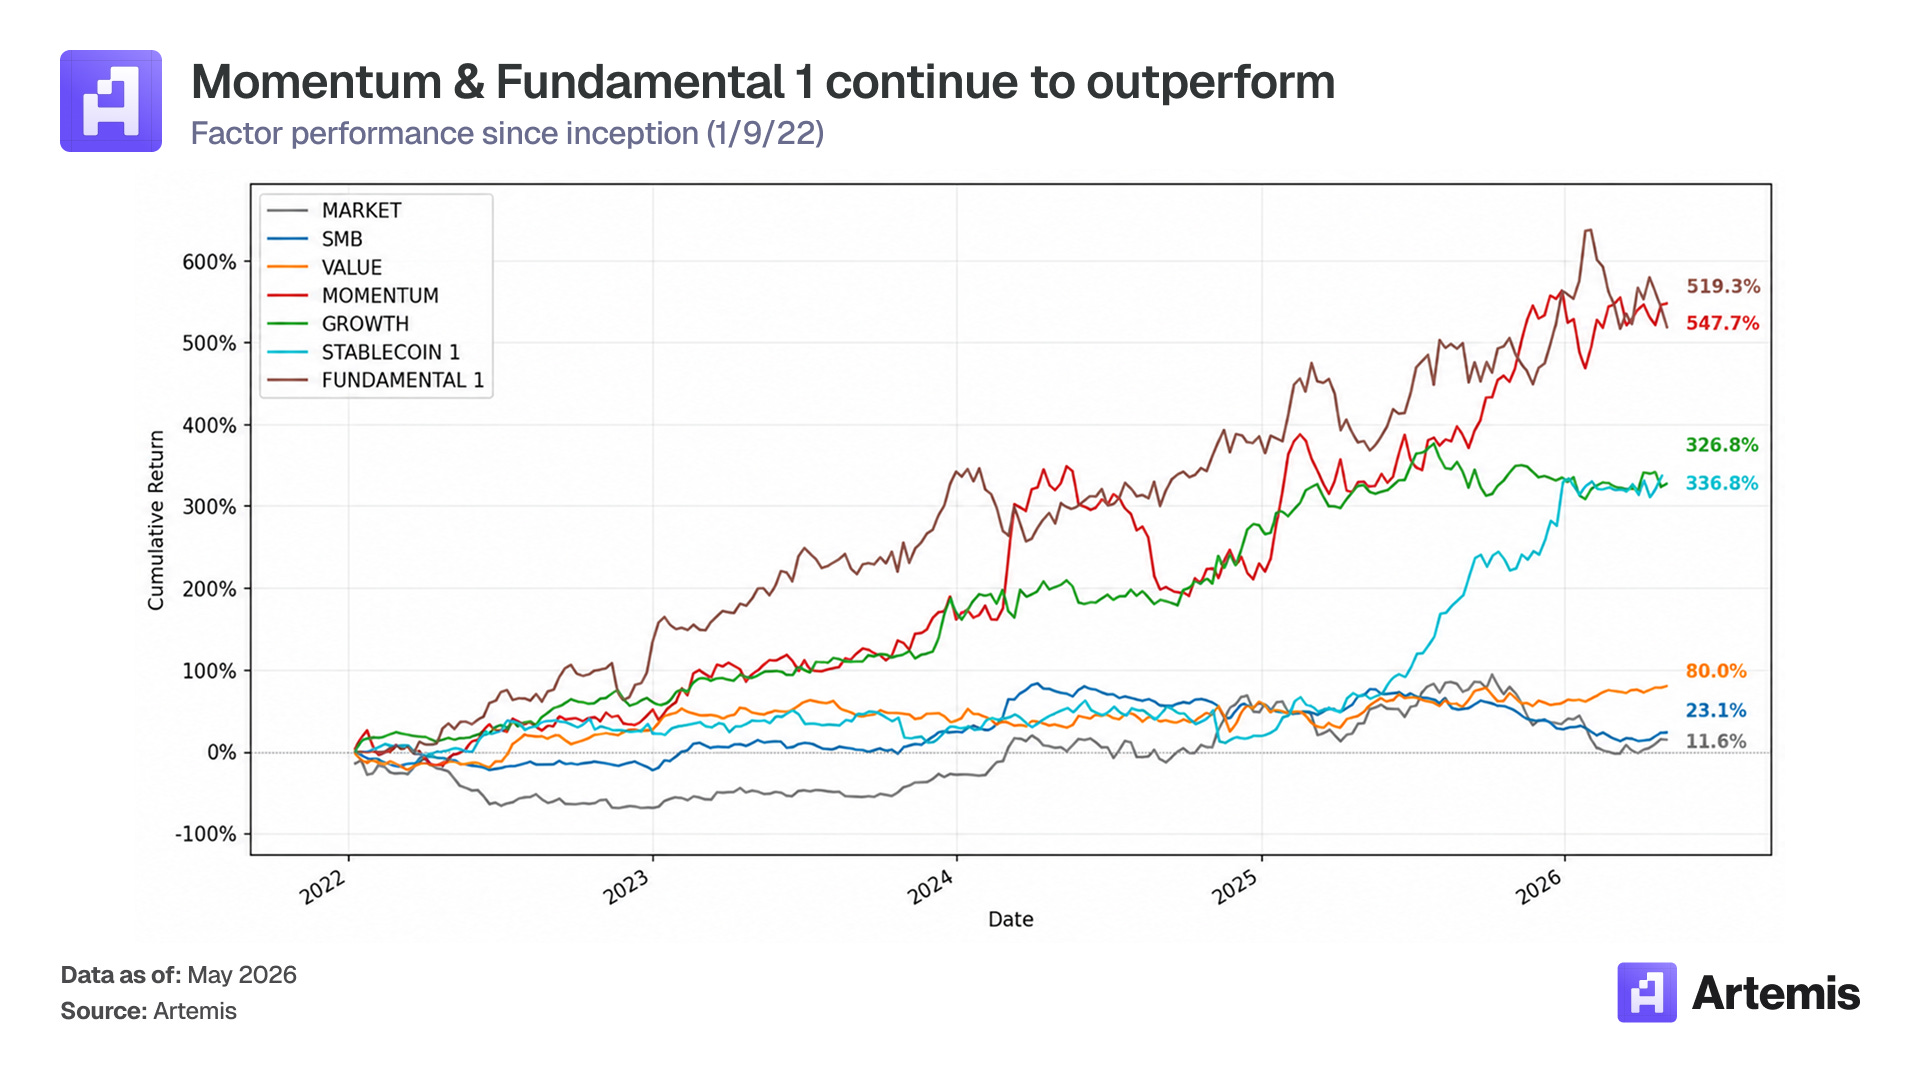
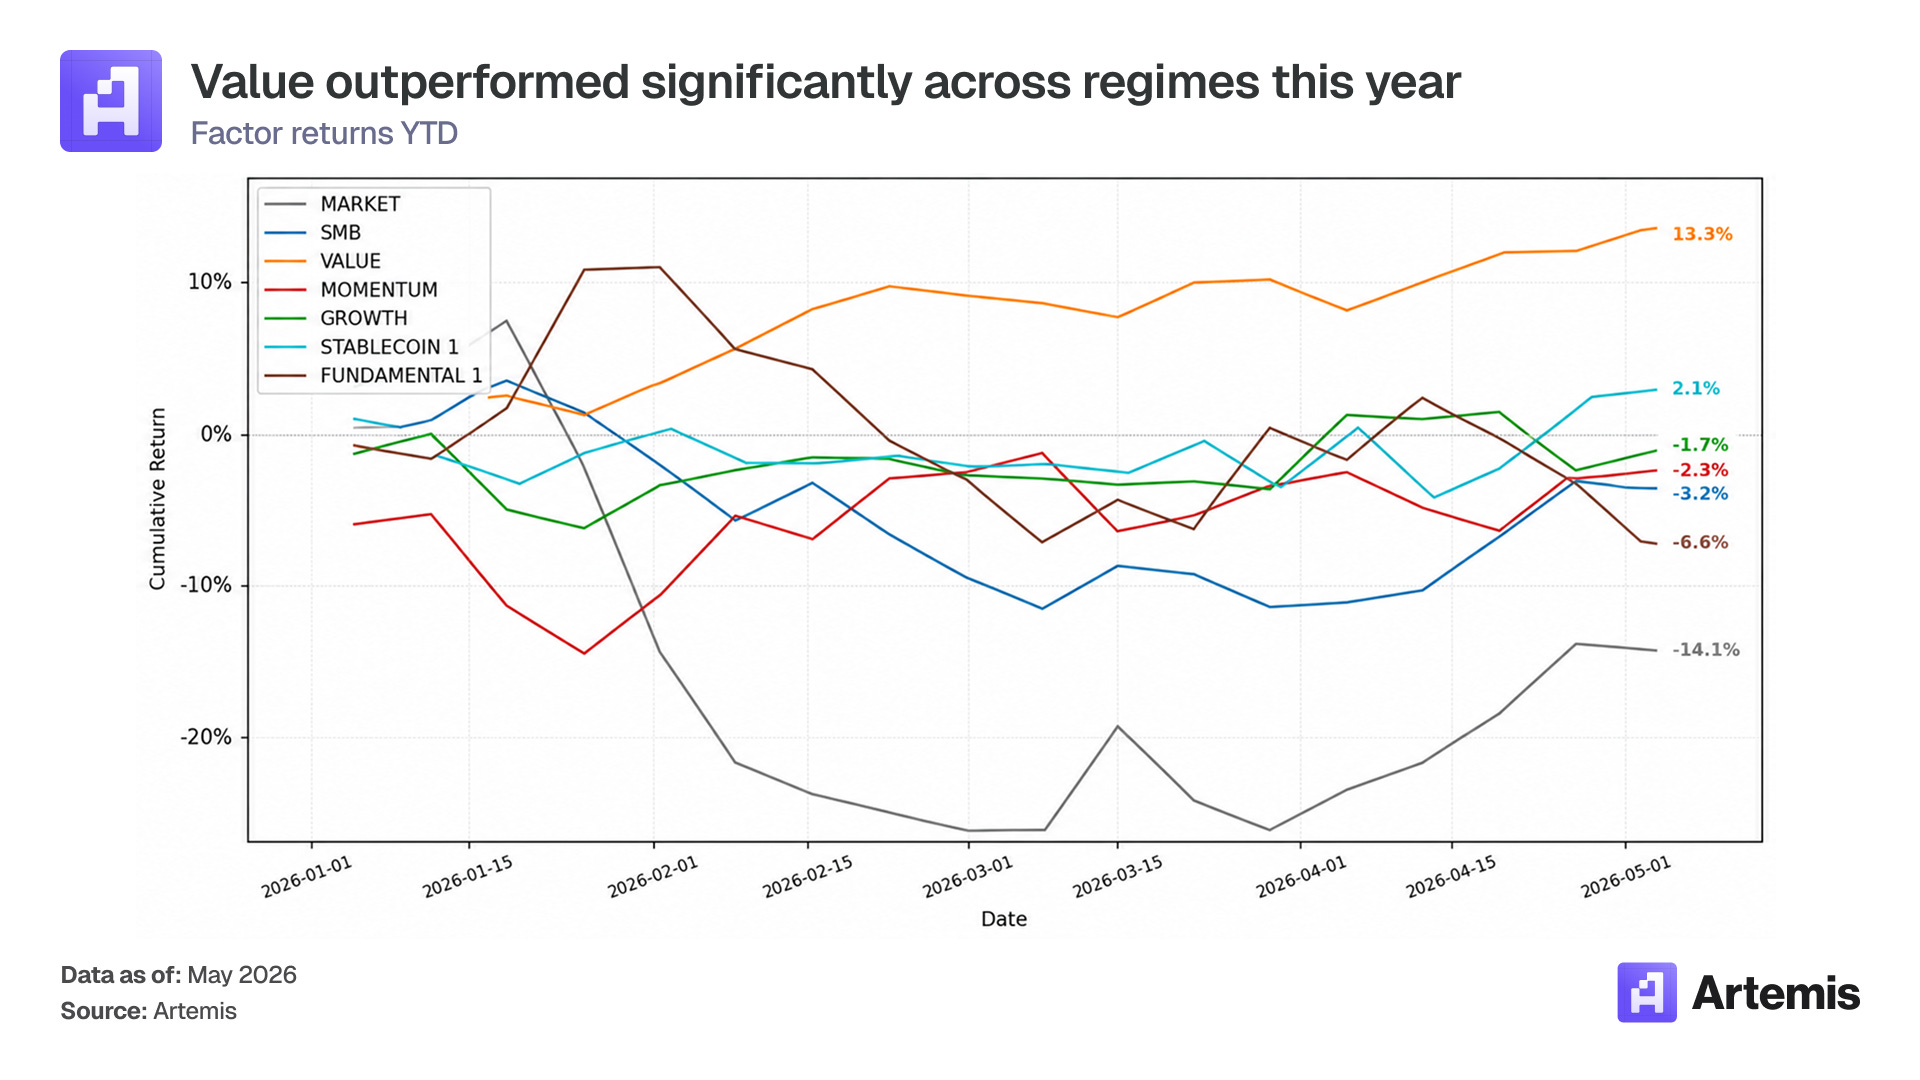
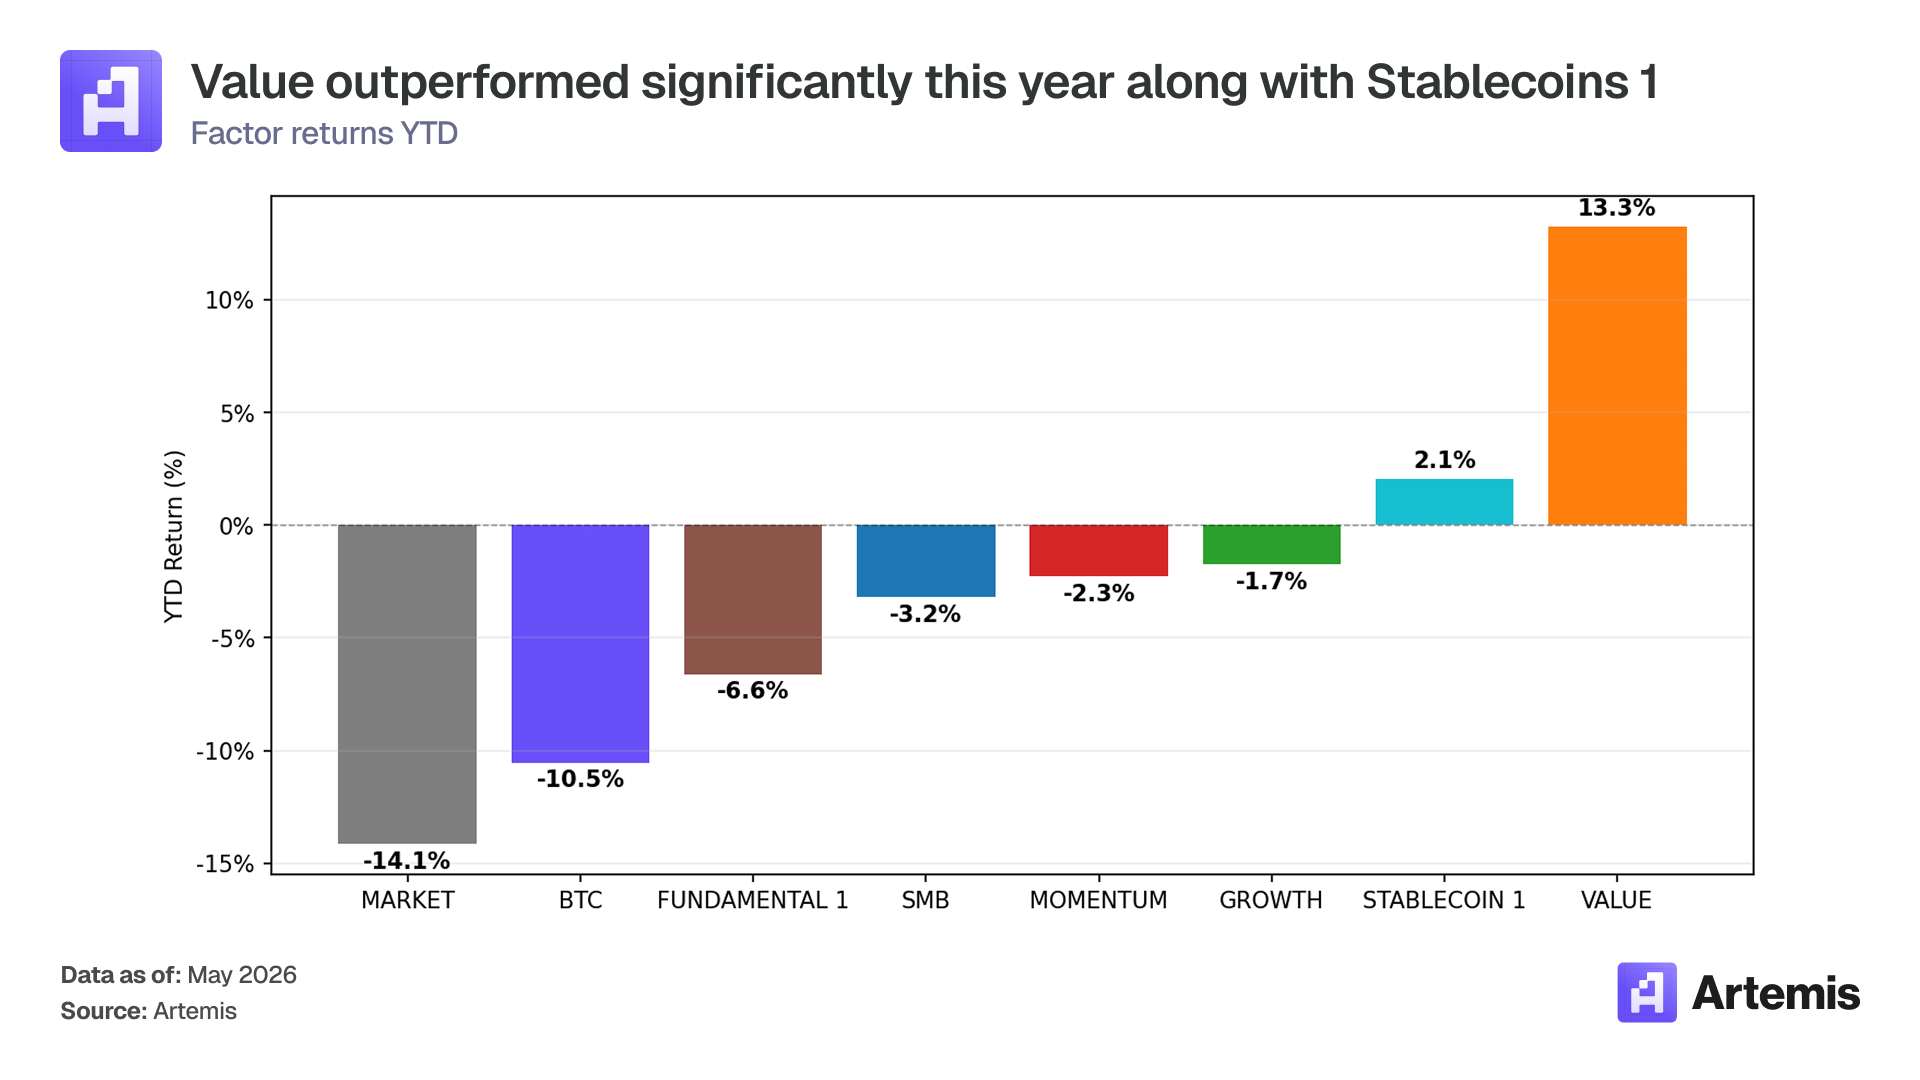
Value (+13.3% YTD) and Stablecoins 1 (+2.1% YTD) remain the only factors positive for the year, while the market factor sits at -14.2% and BTC at -10.5%. Since inception, Momentum (547.7% cumulative) and Fundamentals 1 (519.3%) continue to far outpace passive crypto exposure, demonstrating the framework’s compounding advantage over full cycles.
Market Context
April marked a sharp reversal from March’s risk-off environment. It was the best month for markets in nearly 6 years, as investors priced in positive steps towards a resolution of conflict in the Middle East. US equities rallied hard with the S&P 500 rising about 10.4%, its best month since November 2020 and hitting new all-time highs. AI and tech dominated this rally (Communication Services +18.5% and Technology +17.5%) as investors renewed confidence in AI, cloud, infrastructure, and semiconductors. Emerging markets also gained (MSCI Emerging Markets +14.7%) powered by AI semiconductor supply chain gains in Taiwan (+26.2%) and South Korea (+38.2%). While tensions between the US and Iran continue to dominate headlines, markets are looking through the turmoil and are largely optimistic a resolution will take place.
For a more in depth look into how each of the strategies were built, see our Crypto Factor Model Analysis, Fundamentals 1 strategy, and Stablecoins 1 strategy. For a complementary guide on reading through this report, see our factors guide.
Performance Summary
In April, driven by a shift away from the risk-off regime that defined Q1 2026, crypto market recovery was broad but uneven across strategies. The market-cap-weighted index benefited the most from the rally as large-cap assets like BTC (+19.2%) and ETH (+19.5%) led the charge. SMB also posted a strong +9.2% as small caps participated meaningfully on the risk-on reversal. Stablecoins 1 gained +5.7%, continuing its role as a more defensive, positive-carry strategy that tracks capital flows across chains.
However, the long-short factors that have been the best performers over the prior months, Value (+1.7%), Momentum (+0.9%), and Growth (+1.1%), had relatively muted returns. This is expected as in a broad market rally, the short legs of long-short factors get squeezed as the tokens snap back aggressively, offsetting gains in the long leg. Fundamentals 1 was the only factor with a negative return in April (-3.7%), as its short leg experienced severe reversals from tokens like PENDLE and RAY that rallied sharply.
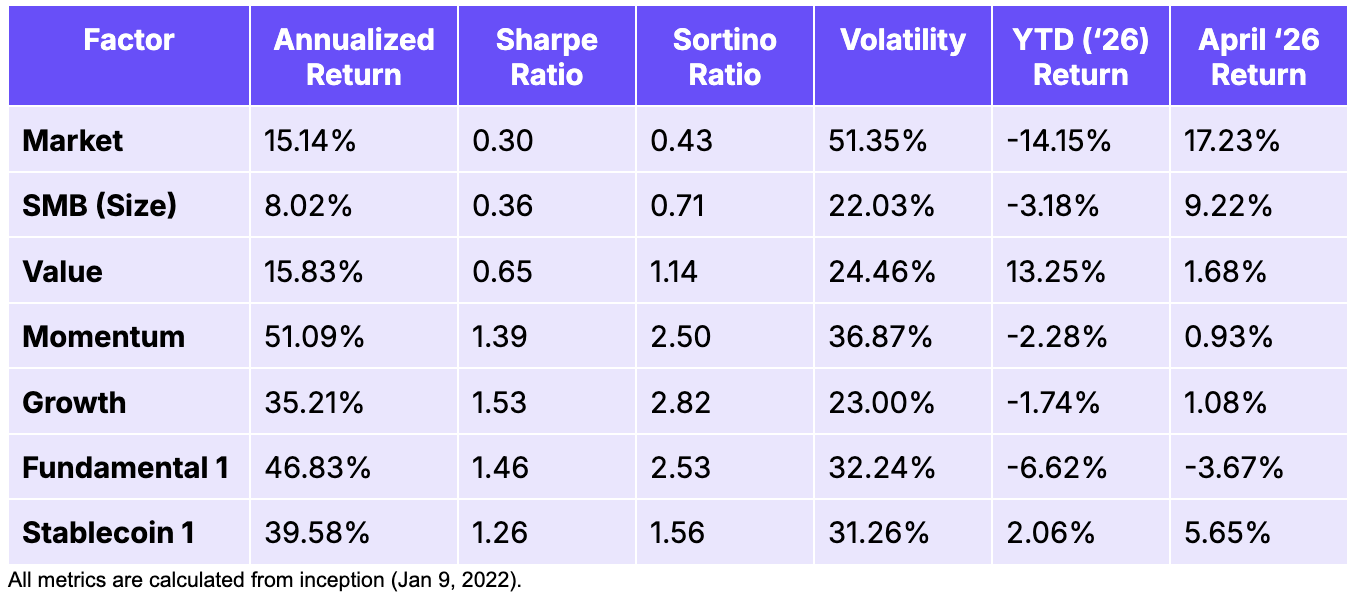
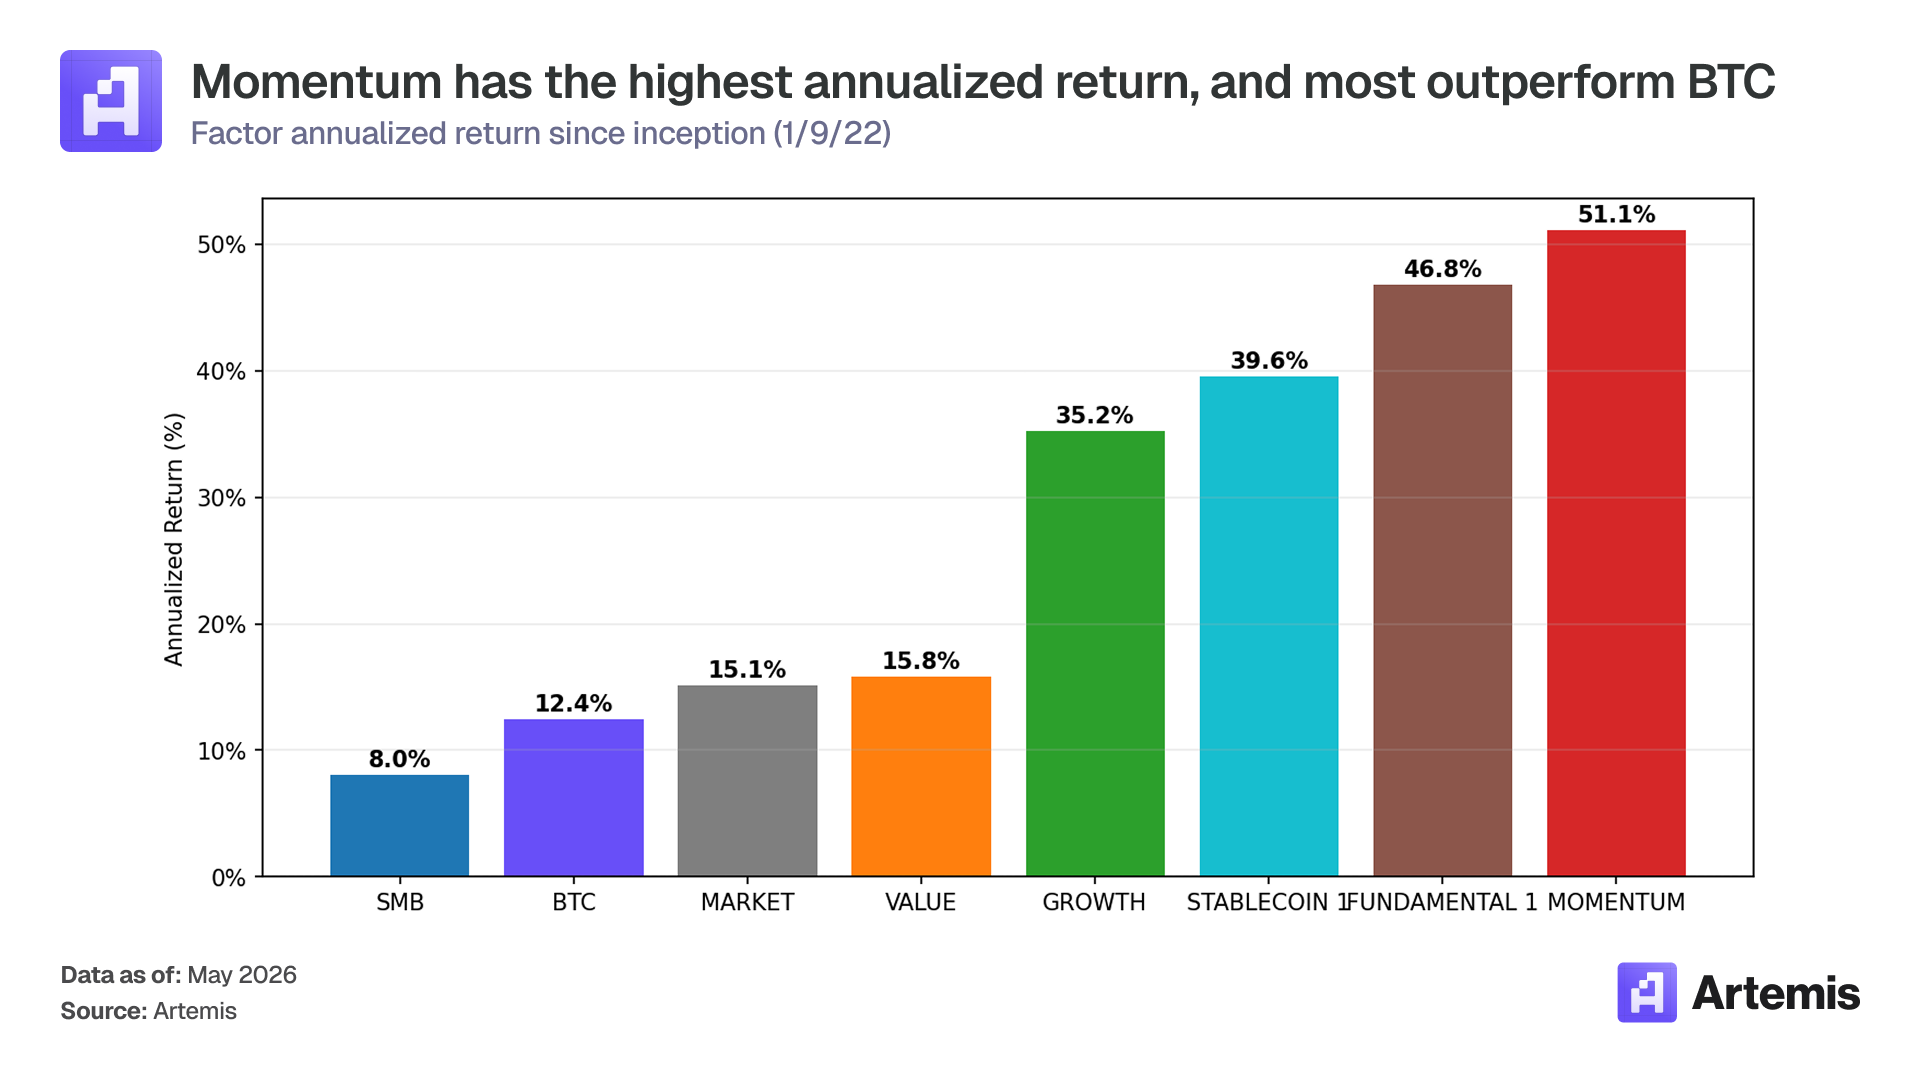
Overall, the factor framework behaved as designed. It limited the downside in the February to March drawdown and underperformed the market in a sharp recovery month. Since inception, Momentum (51.1% annualized) and Fundamental 1 (46.8% annualized) remain far ahead of the market factor (15.1% annualized). Value continues to stand out as the best YTD performer at 13.3%, having navigated both the drawdown and recovery with minimal volatility.
Market Risk Factor
Construction
Long-only portfolio of the top 10 assets by market cap, market cap-weighted, rebalanced weekly. Captures broad crypto market exposure similar to a crypto index.
Current Holdings
BTC (73.2%), ETH (13.1%), XRP (4.0%), BNB (3.9%), SOL (2.3%), TRX (1.5%), DOGE (0.8%), HYPE (0.5%), ADA (0.4%), BCH (0.4%)
Performance Metrics
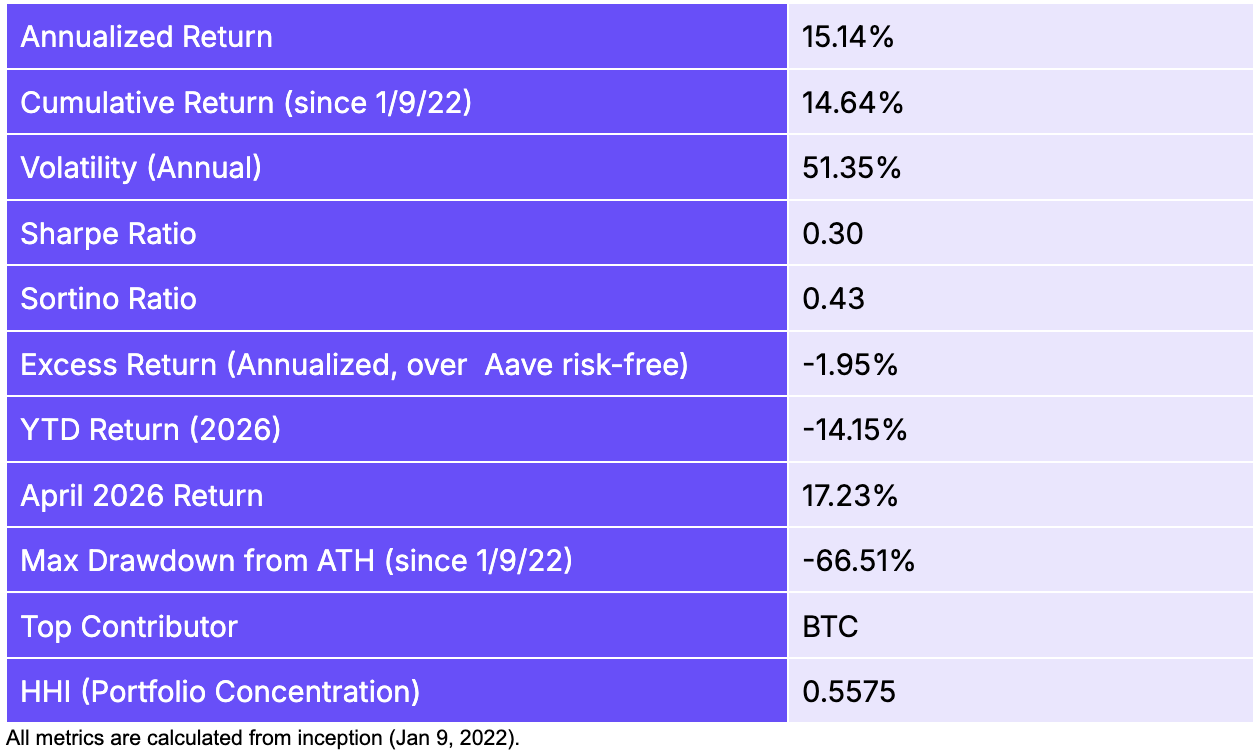
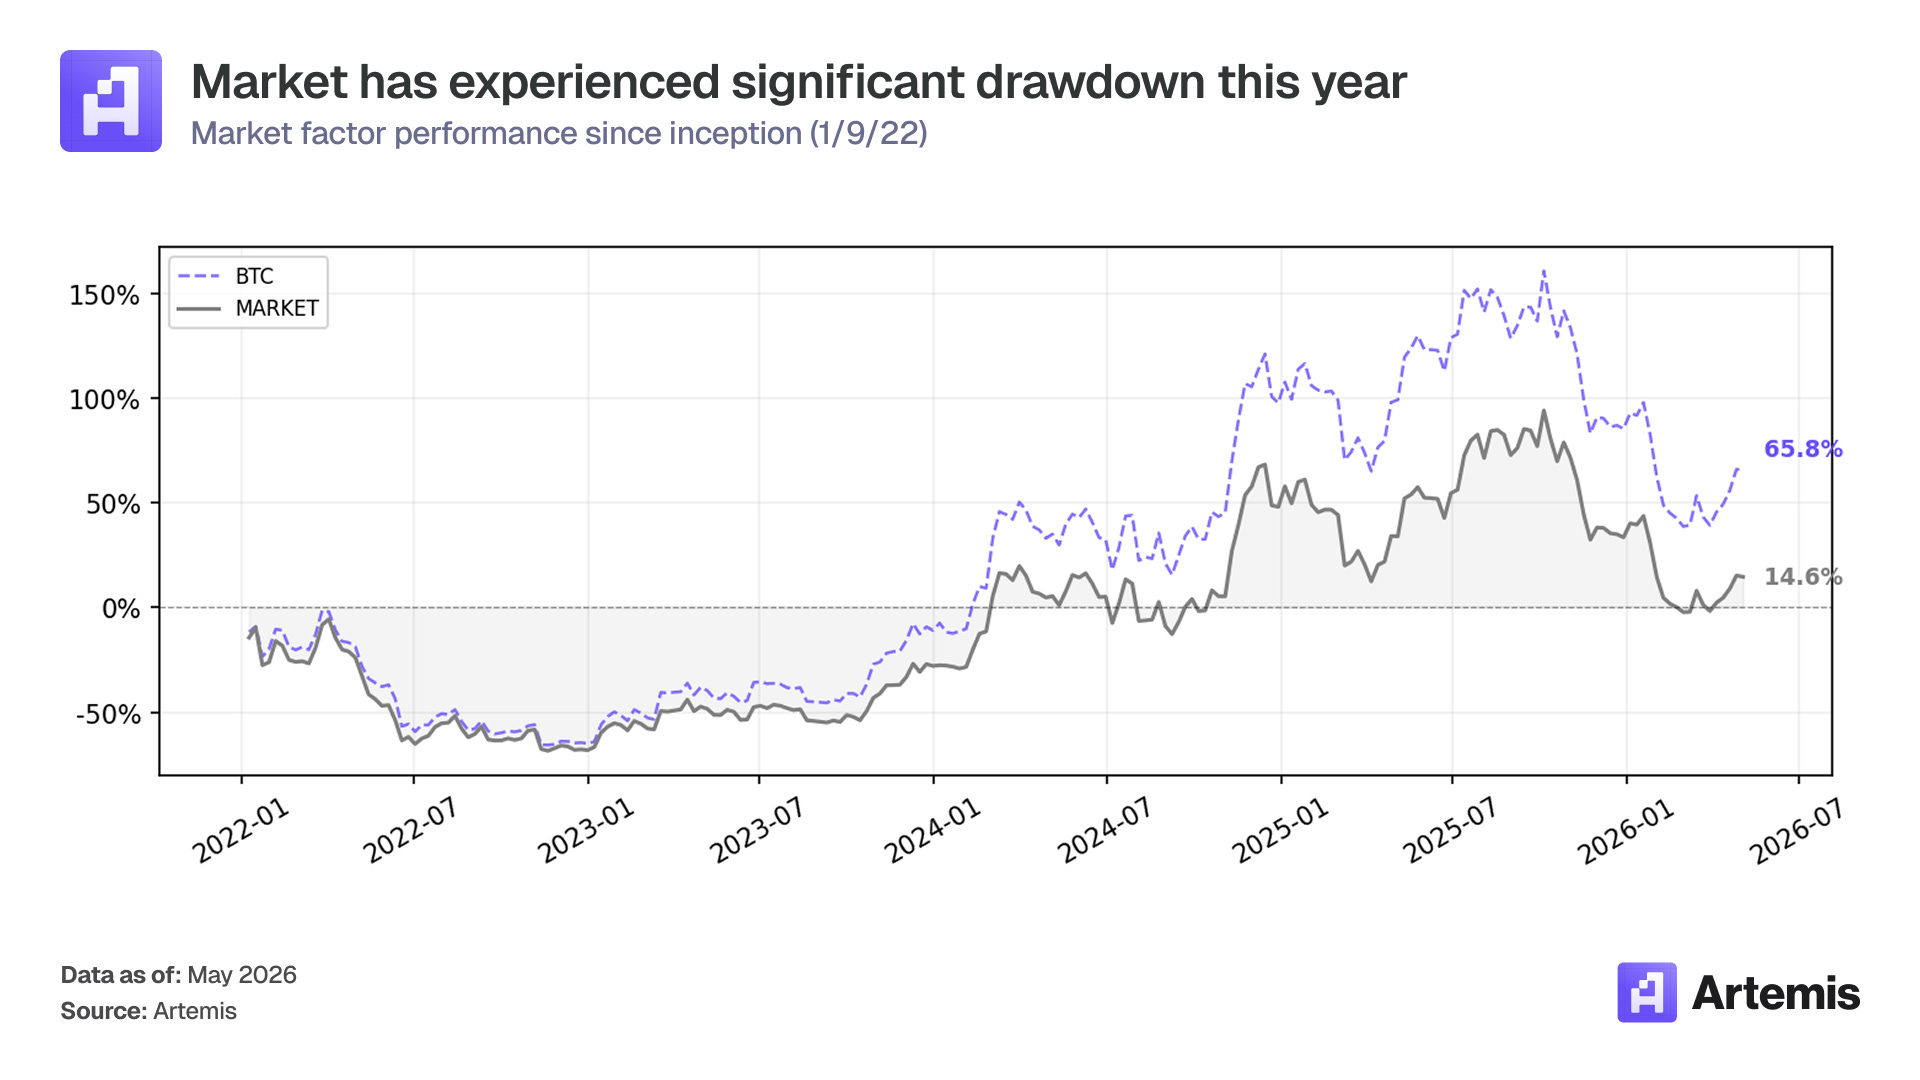
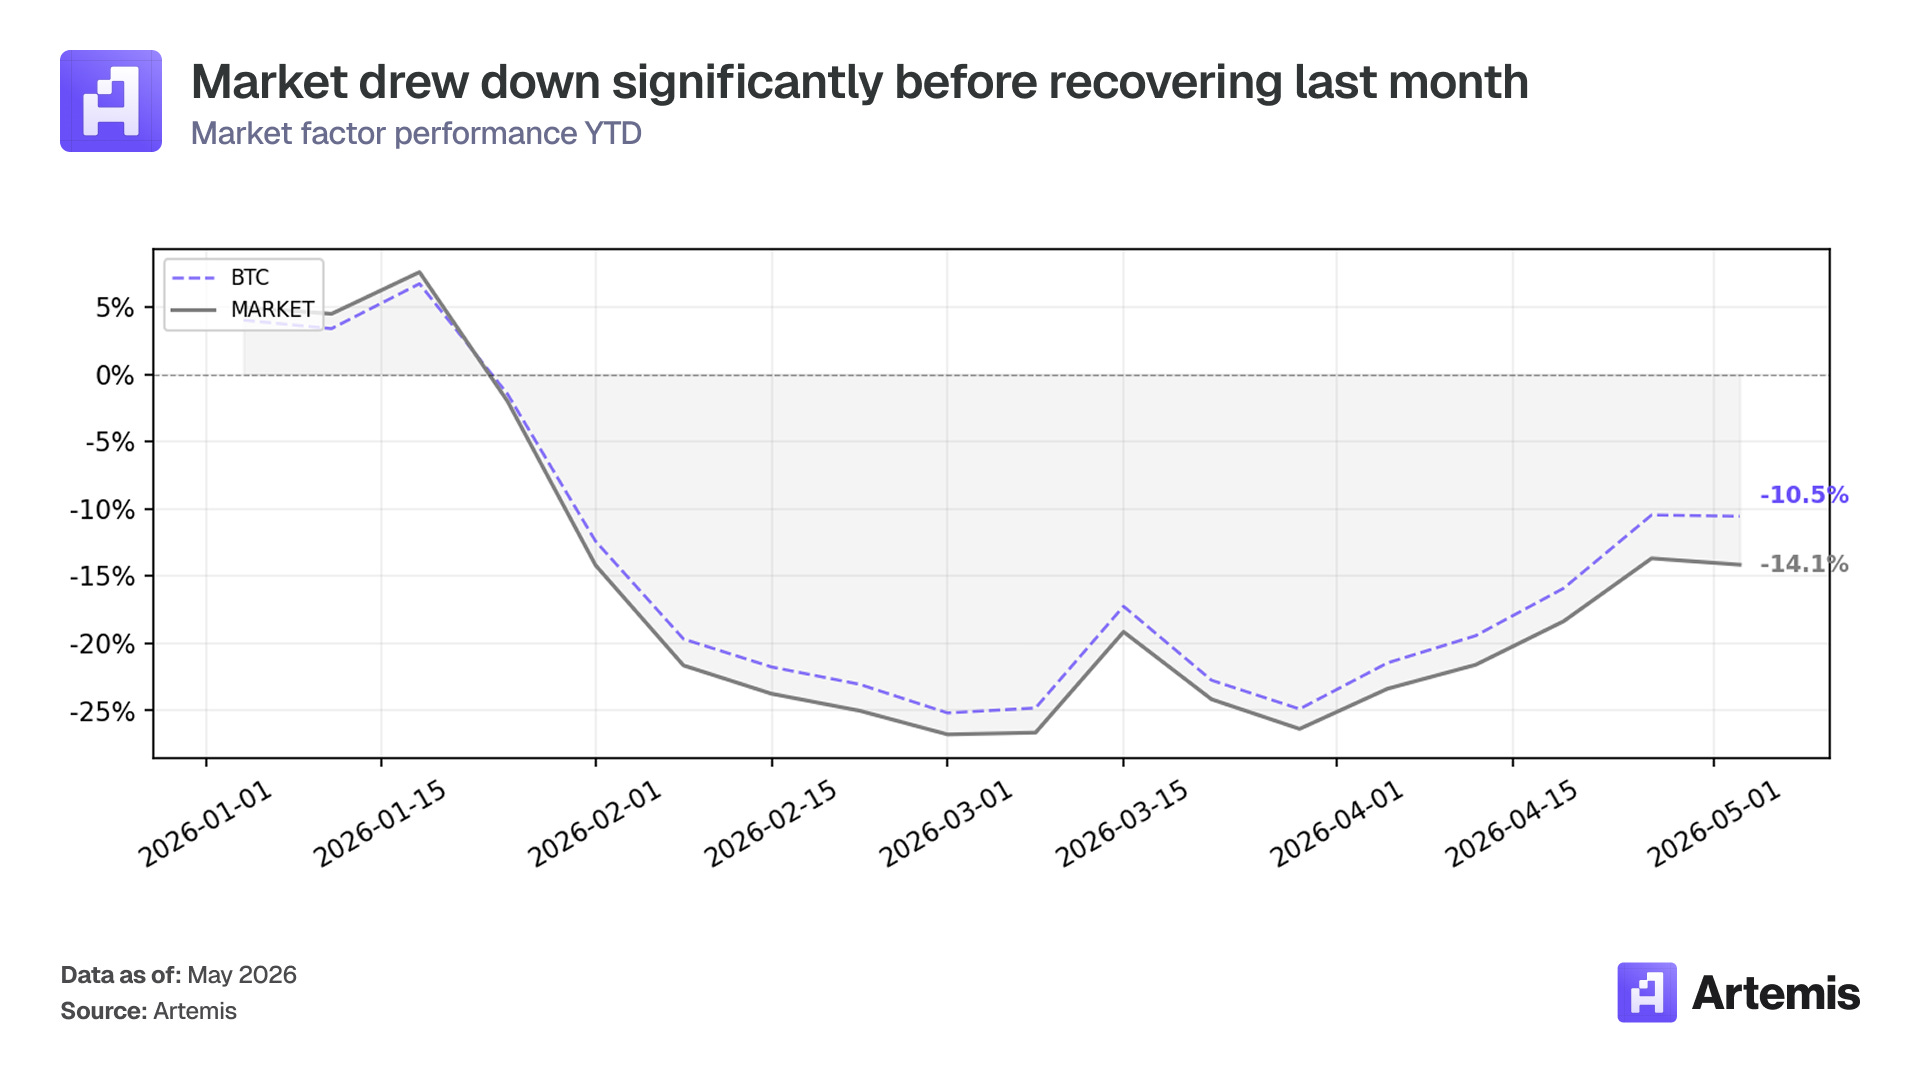
The market factor’s +17.2% April return was a relief after months of decline. BTC surged +19.2% as institutional demand returned and a broader risk-on rotation rallied both crypto and equities mid-April. Despite the strong month, the portfolio remains well below its all-time high, with a max drawdown since inception of -66.5% reflecting the severity of the 2022 bear market and the early 2026 Iran war shock. The April rally narrowed the YTD gap between BTC (-10.5%) and the broader market factor (-14.2%), but the market index still lags BTC on a YTD basis, reflecting the ongoing underperformance of most altcoins relative to Bitcoin even during the recovery.
Top 5 Winners & Losers for April
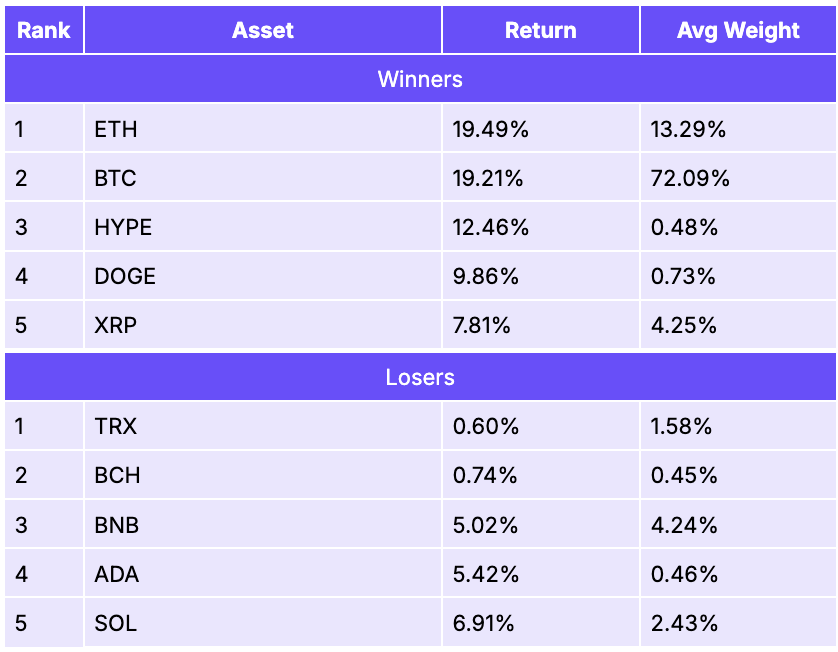
ETH (+19.5%) was the top contributor by return, benefiting from the macro risk-on rotation and several institutional catalysts. BlackRock launched a staked Ethereum ETF (ETHB) that attracted tens of millions in daily flow. The upcoming Glamsterdam upgrade, targeting a significant gas reduction and parallel transaction execution, and the Ethereum Foundation’s 70,000 ETH staking commitment, signaling a shift from selling pressure to productive deployment of its treasury, were both additional forward catalysts. BTC (+19.2%) followed closely, driven by demand from digital asset treasury firms like Strategy (MSTR) and Bitmine sustaining strong demand, along with a weakening dollar and easing oil-war fears that supported risk assets broadly. HYPE (+12.5%) continued its multi-month outperformance as the platform hit a new all-time high of 6.9% open interest share relative to centralized exchanges. There were no negative losers in April, but TRX (+0.6%) and BCH (+0.7%) lagged significantly.
Size Factor
Construction
Equal-weighted long-short factor: long the smallest 50% of eligible assets by market cap, short the largest 50%. Minimum 40 assets (20 per leg). Breakpoint: 50th percentile of market cap.
Performance Metrics

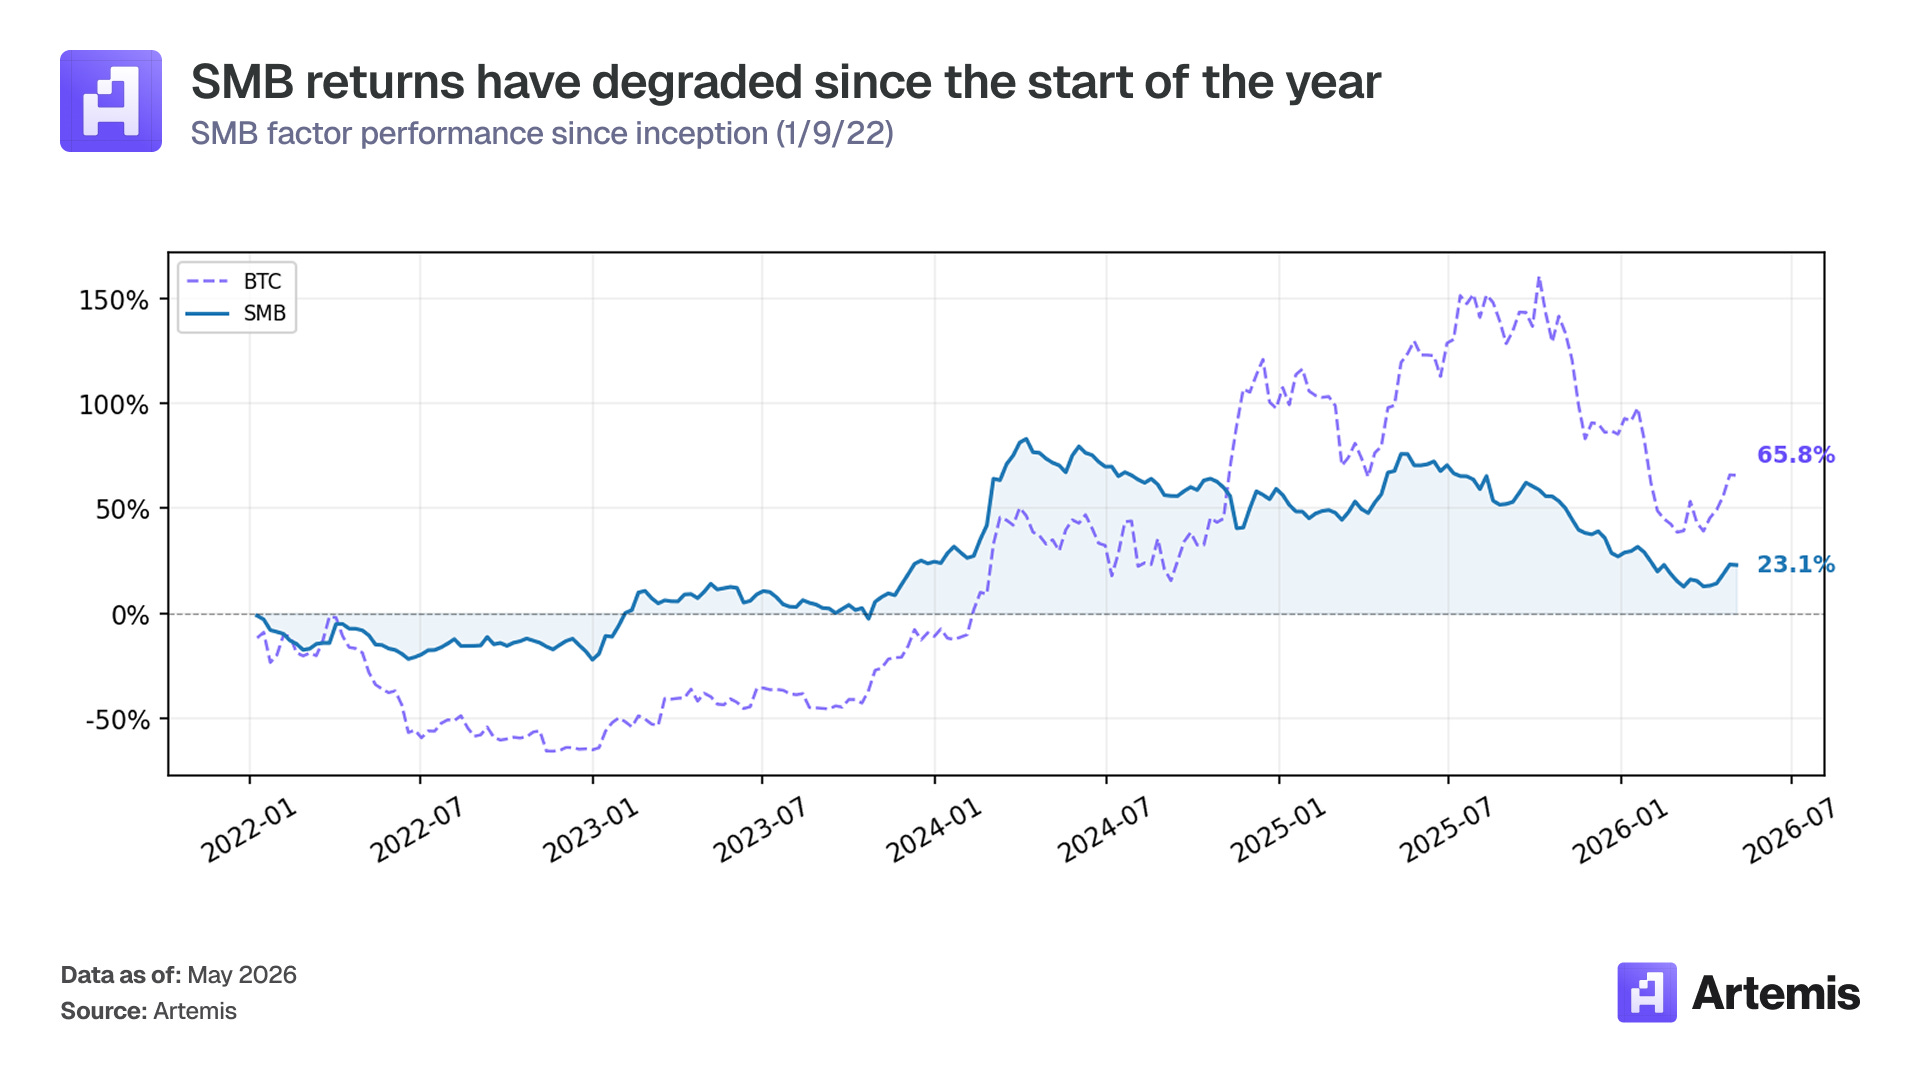
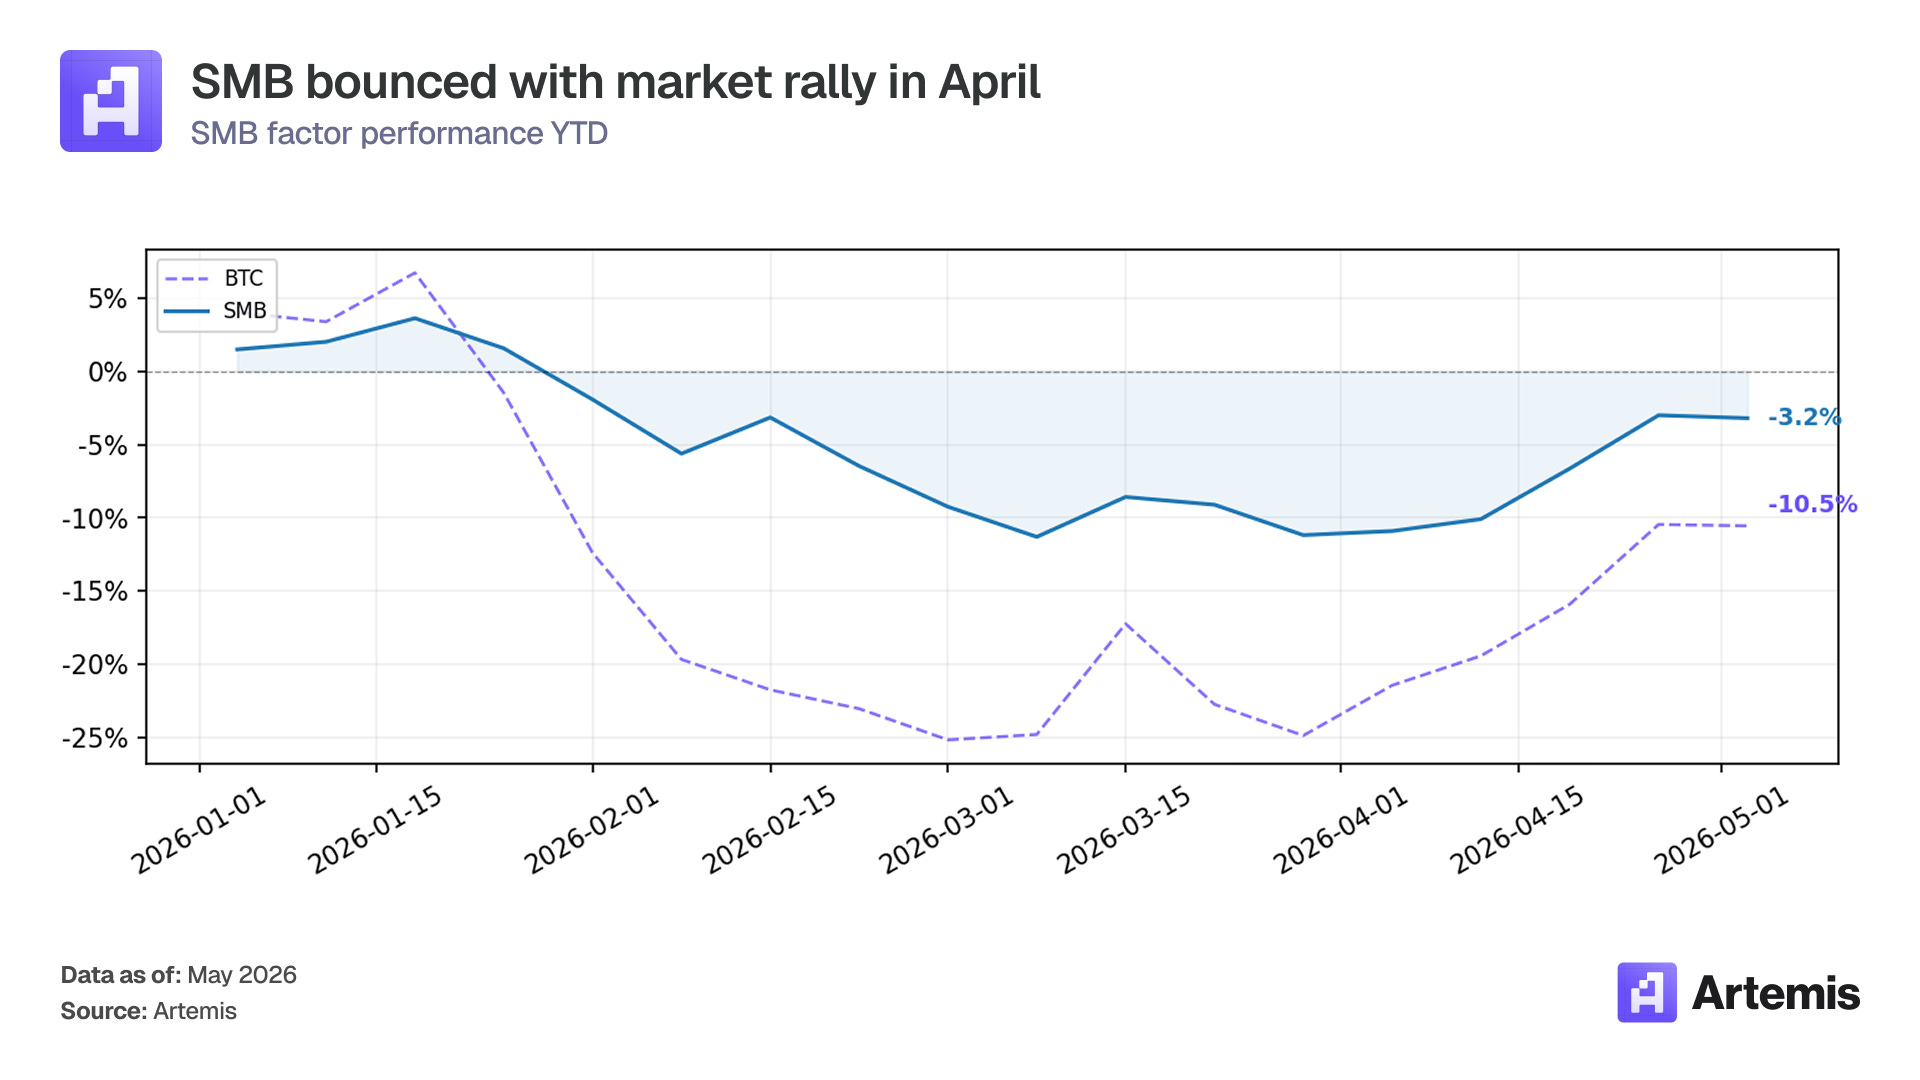
SMB returned +9.2% in April, a recovery from the prior months of small-cap underperformance. YTD losses narrowed to -3.2% from -13.7% at the end of March, and the max drawdown since inception stands at -38.4%. The recovery was driven by the risk-on rotation: as sentiment turned, capital flowed back into smaller, more speculative assets that had been oversold in the February-March selloff. Small caps broadly rallied harder than large caps during April, which is the expected pattern in a market recovery.
Despite the strong monthly return, the SMB factor’s annualized return of 8.0% and Sharpe of 0.36 remain the weakest across all factors since inception. While the size premium for crypto exists over long periods, it is extremely volatile and tends to underperform during risk-off regimes that have dominated early 2026.
Top 5 Winners & Losers for April
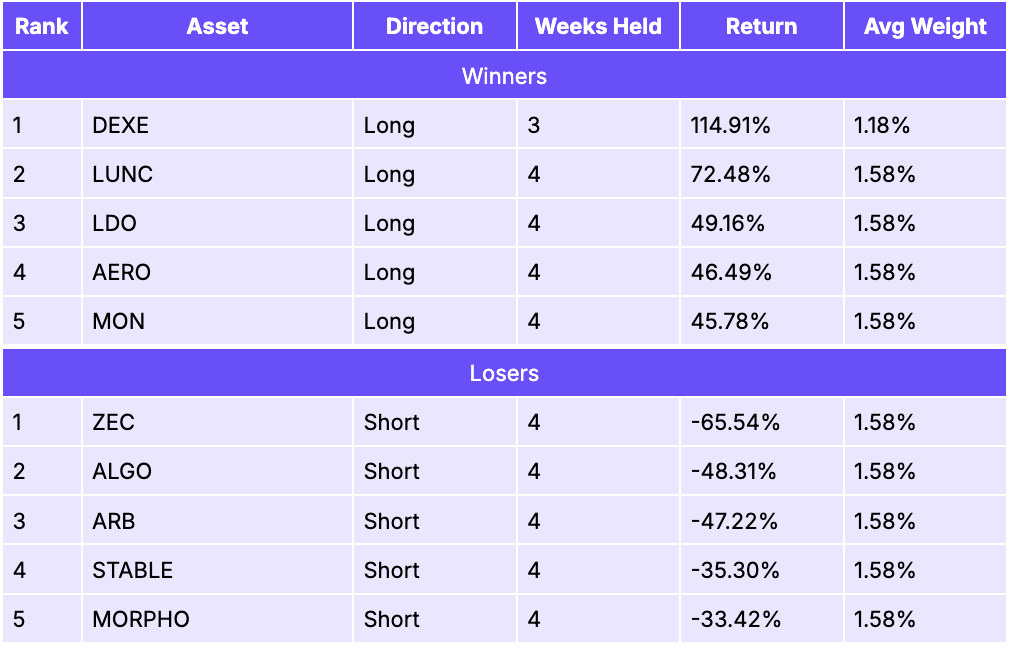
DEXE (+114.91% as a long) was by far the top contributor, extending its rally that began in March. The DAO governance platform token more than doubled during the month, driven by surging demand for on-chain governance infrastructure as institutional capital increasingly sought DAO coordination tools. DEXE’s market cap climbed from roughly $350 million to over $680 million in April alone, with daily volumes regularly exceeding $30-50 million. High staking APRs (up to 102%) locked up circulating supply, amplifying the rally. LUNC (+72.48% as a long) was fueled by accelerating token burn mechanics. The community burned over 2 billion LUNC in April, with Binance’s monthly burn contributing hundreds of millions. The successful Cosmos SDK v0.53 integration improved cross-chain connectivity, and the upcoming v4.0.1 governance vote provided a forward catalyst. LDO (+49.16% as a long) rallied after the Lido DAO proposed a $20 million LDO buyback using treasury funds, signaling strong conviction in the protocol’s fundamentals. A whale purchase of $1.86 million in LDO followed the announcement. AERO (+46.49% as a long) benefited from growing Base ecosystem activity and anticipation of its cross-chain DEX launch planned for July 2026, with smart money wallets accumulating aggressively.
On the losing side, ZEC (-65.54% as a short) was the largest detractor. Zcash rallied explosively in April, up over 50% in the month, driven by the SEC’s January clearance (no enforcement action), Grayscale’s landmark filing to convert its Zcash Trust into the first-ever privacy coin spot ETF, and institutional accumulation by firms like Multicoin Capital and Cypherpunk Technologies. With 30% of ZEC supply in shielded pools and the 2024 halving tightening issuance, the supply squeeze punished the factor’s short positioning.
Value Factor
Construction
Equal-weighted long-short: long assets with the lowest Market Cap / Fees ratio (highest fundamental value), short assets with the highest MC / Fees ratio (most expensive). Minimum 30 assets (15 per leg).
Performance Metrics

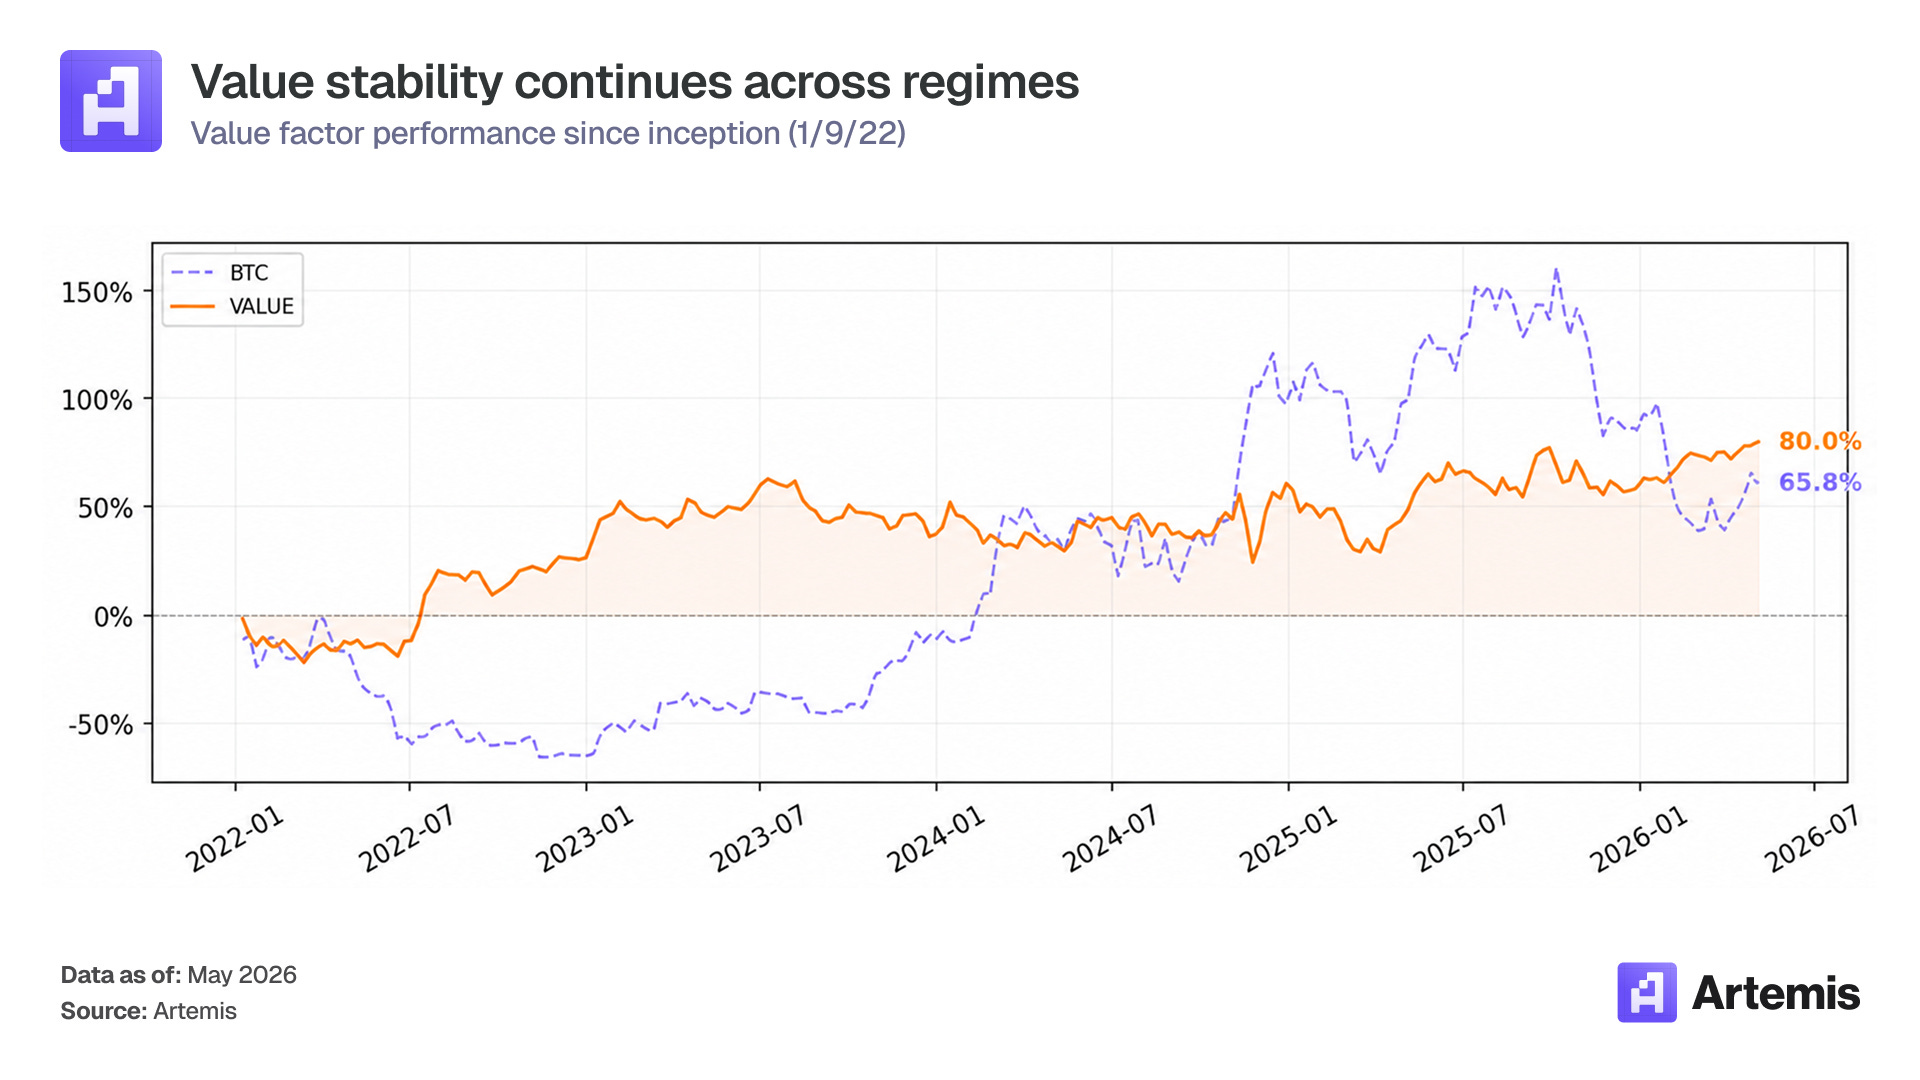
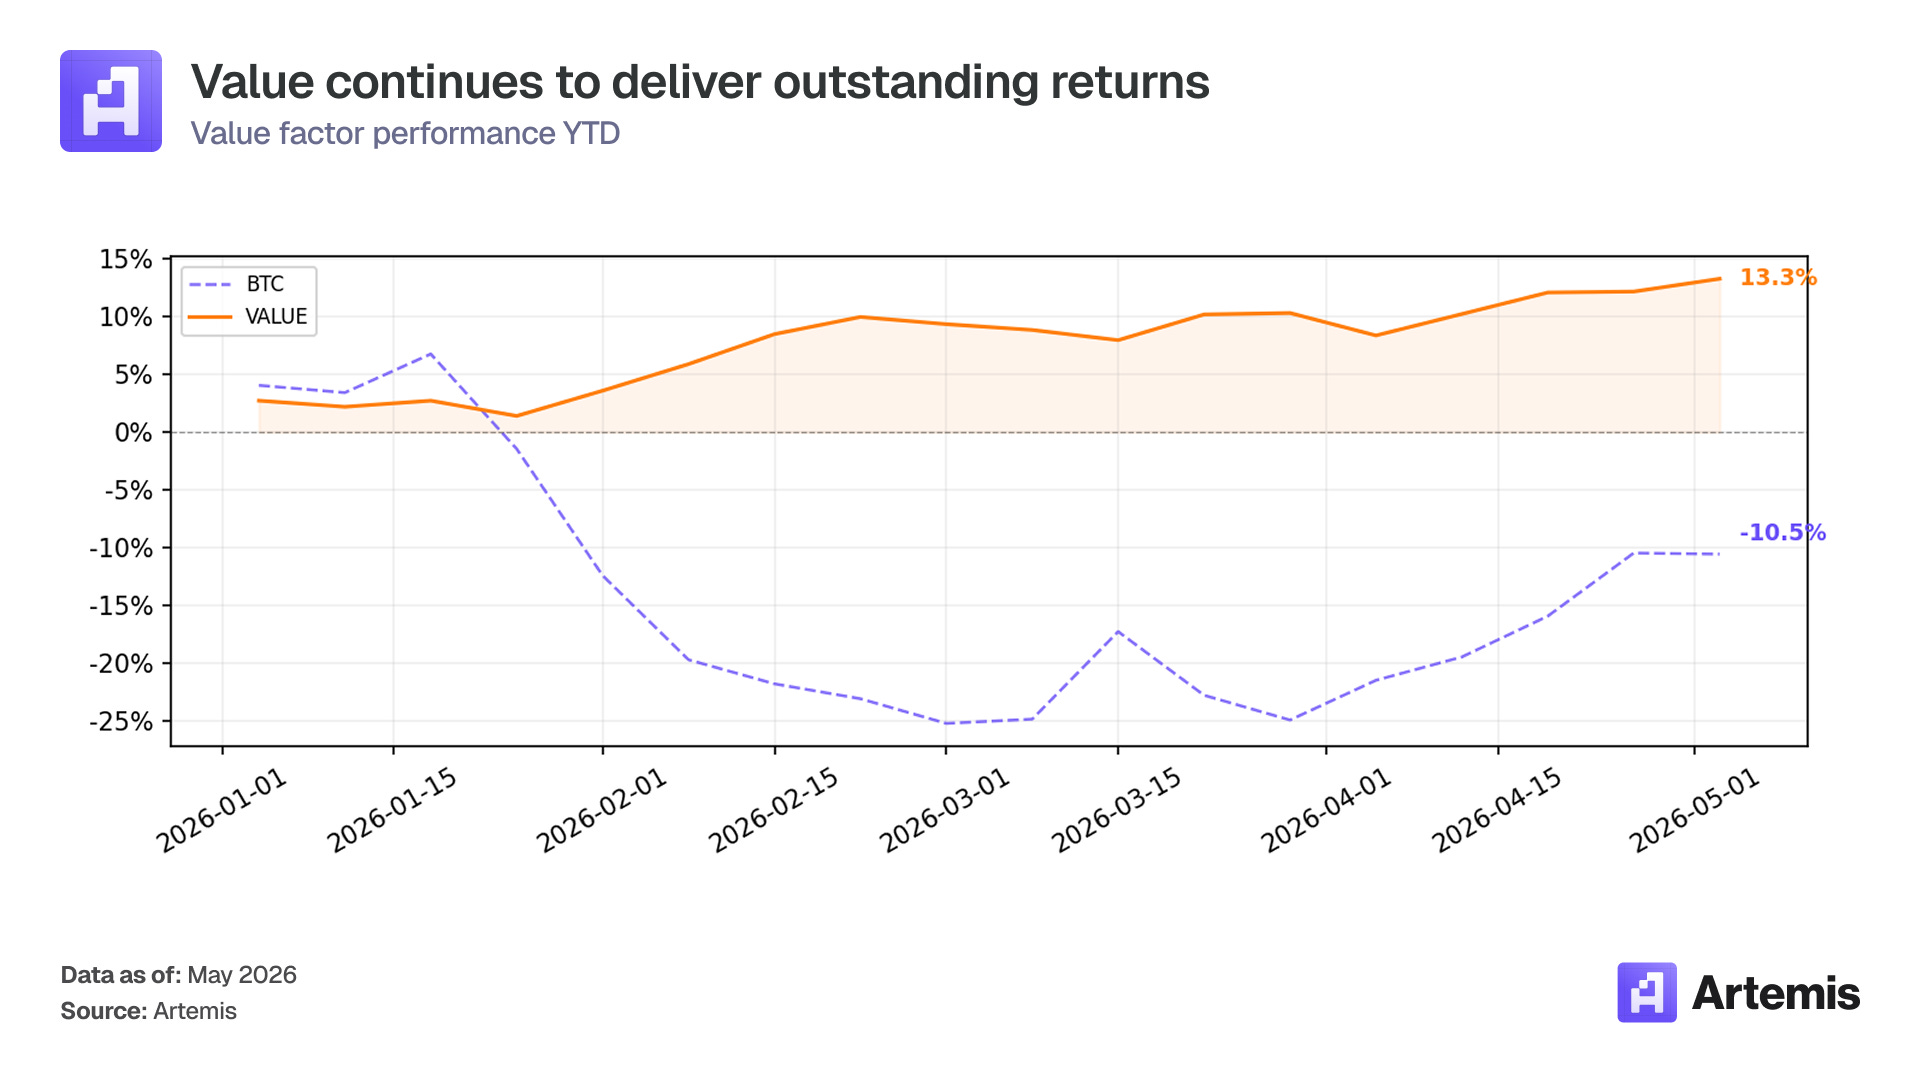
Value returned +1.7% in April, a modest but positive result that extends its streak as the most consistent factor in 2026. YTD returns stand at +13.3%, the highest among all factors. The max drawdown since inception of -23.4% is considerably shallower than most other factors, reflecting Value’s defensive character across regimes. Value has navigated both the brutal February-March selloff and April’s recovery with remarkable stability.
Top 5 Winners & Losers for April
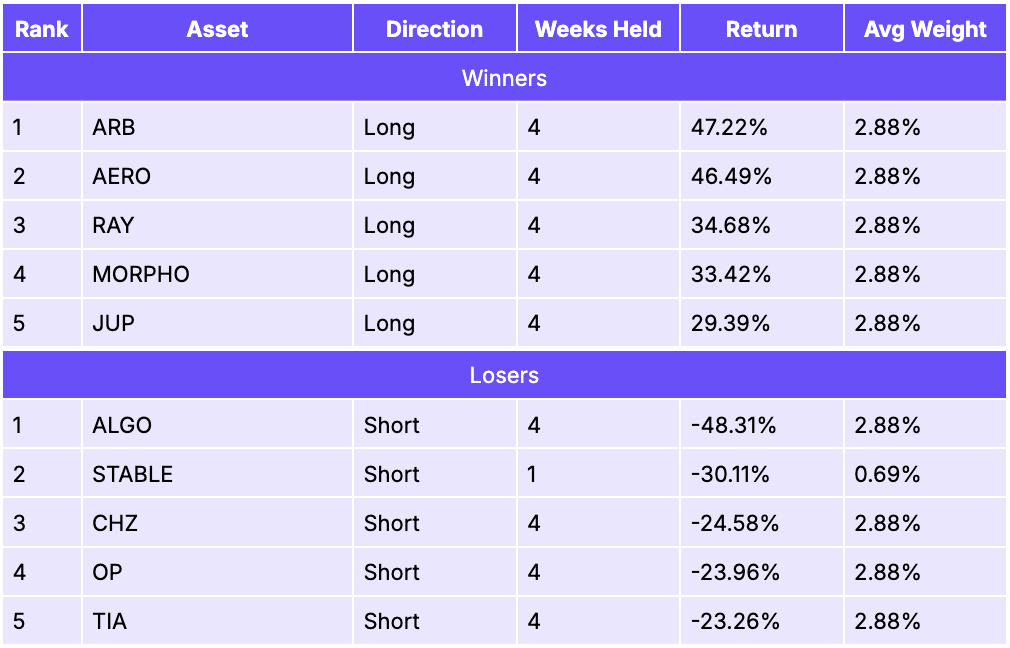
ARB (+47.2% as a long) was the top contributor, benefiting from a sharp L2 sector recovery. Arbitrum’s fee generation made it fundamentally cheap on a MC/Fees basis, and the broader market rally lifted L2 tokens that had been heavily sold off. AERO (+46.5% as a long) rallied on strong DeFi fundamentals (see SMB commentary for details). RAY (+34.7% as a long) and MORPHO (+33.4% as a long) also contributed from the long leg, both representing fundamentally cheap DeFi protocols that benefited from the sector rotation back into risk assets. JUP (+29.4% as a long) rounded out the winners as Jupiter’s dominance of Solana DEX aggregation continued to generate strong fees.
On the losing side, ALGO (-48.3% as a short) was the worst performer. Algorand rallied sharply despite its elevated MC/Fees ratio, as the token continued to benefit from the SEC’s declaration in March that it was a digital commodity, which resolved years of regulatory uncertainty. CHZ (-24.6% as a short) gained on World Cup-driven momentum. Chiliz’s roadmap for omnichain fan tokens and CHZ buybacks ahead of the 2026 FIFA World Cup continued to attract speculative flows.
Momentum Factor
Construction
Volatility-adjusted momentum: calculates 3-week rolling Sharpe-like score (mean return / std dev of daily return) for each asset. Long top 25% by filtered momentum, short bottom 25%. Equal-weighted, minimum 30 assets (15 per leg).
Performance Metrics
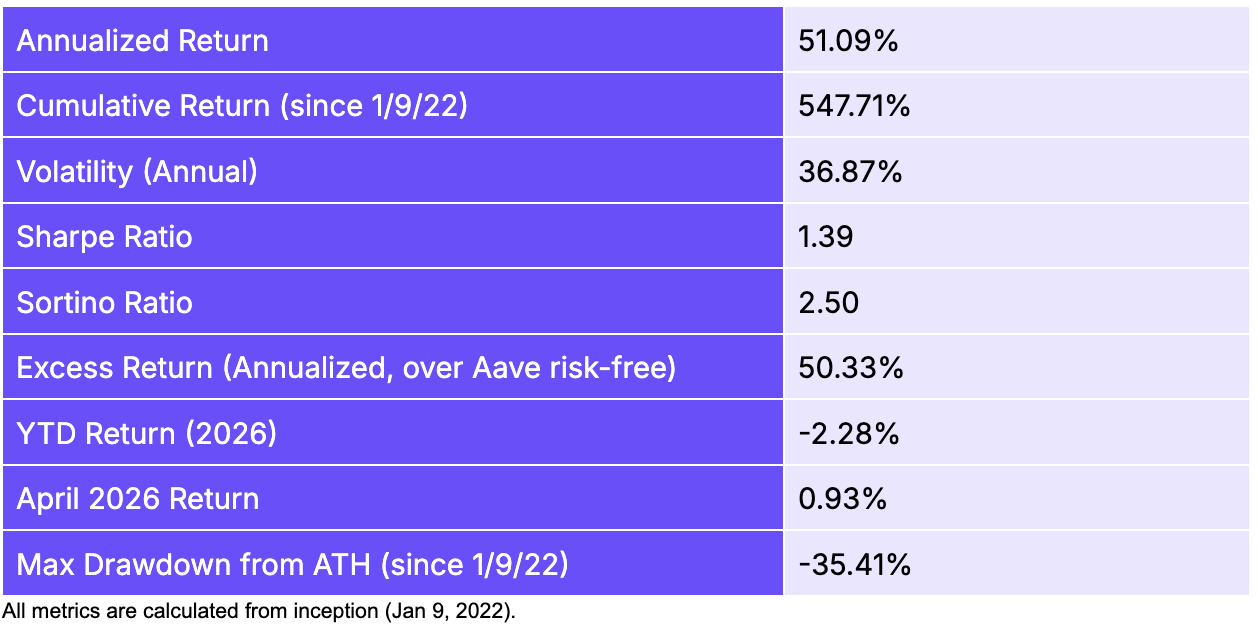
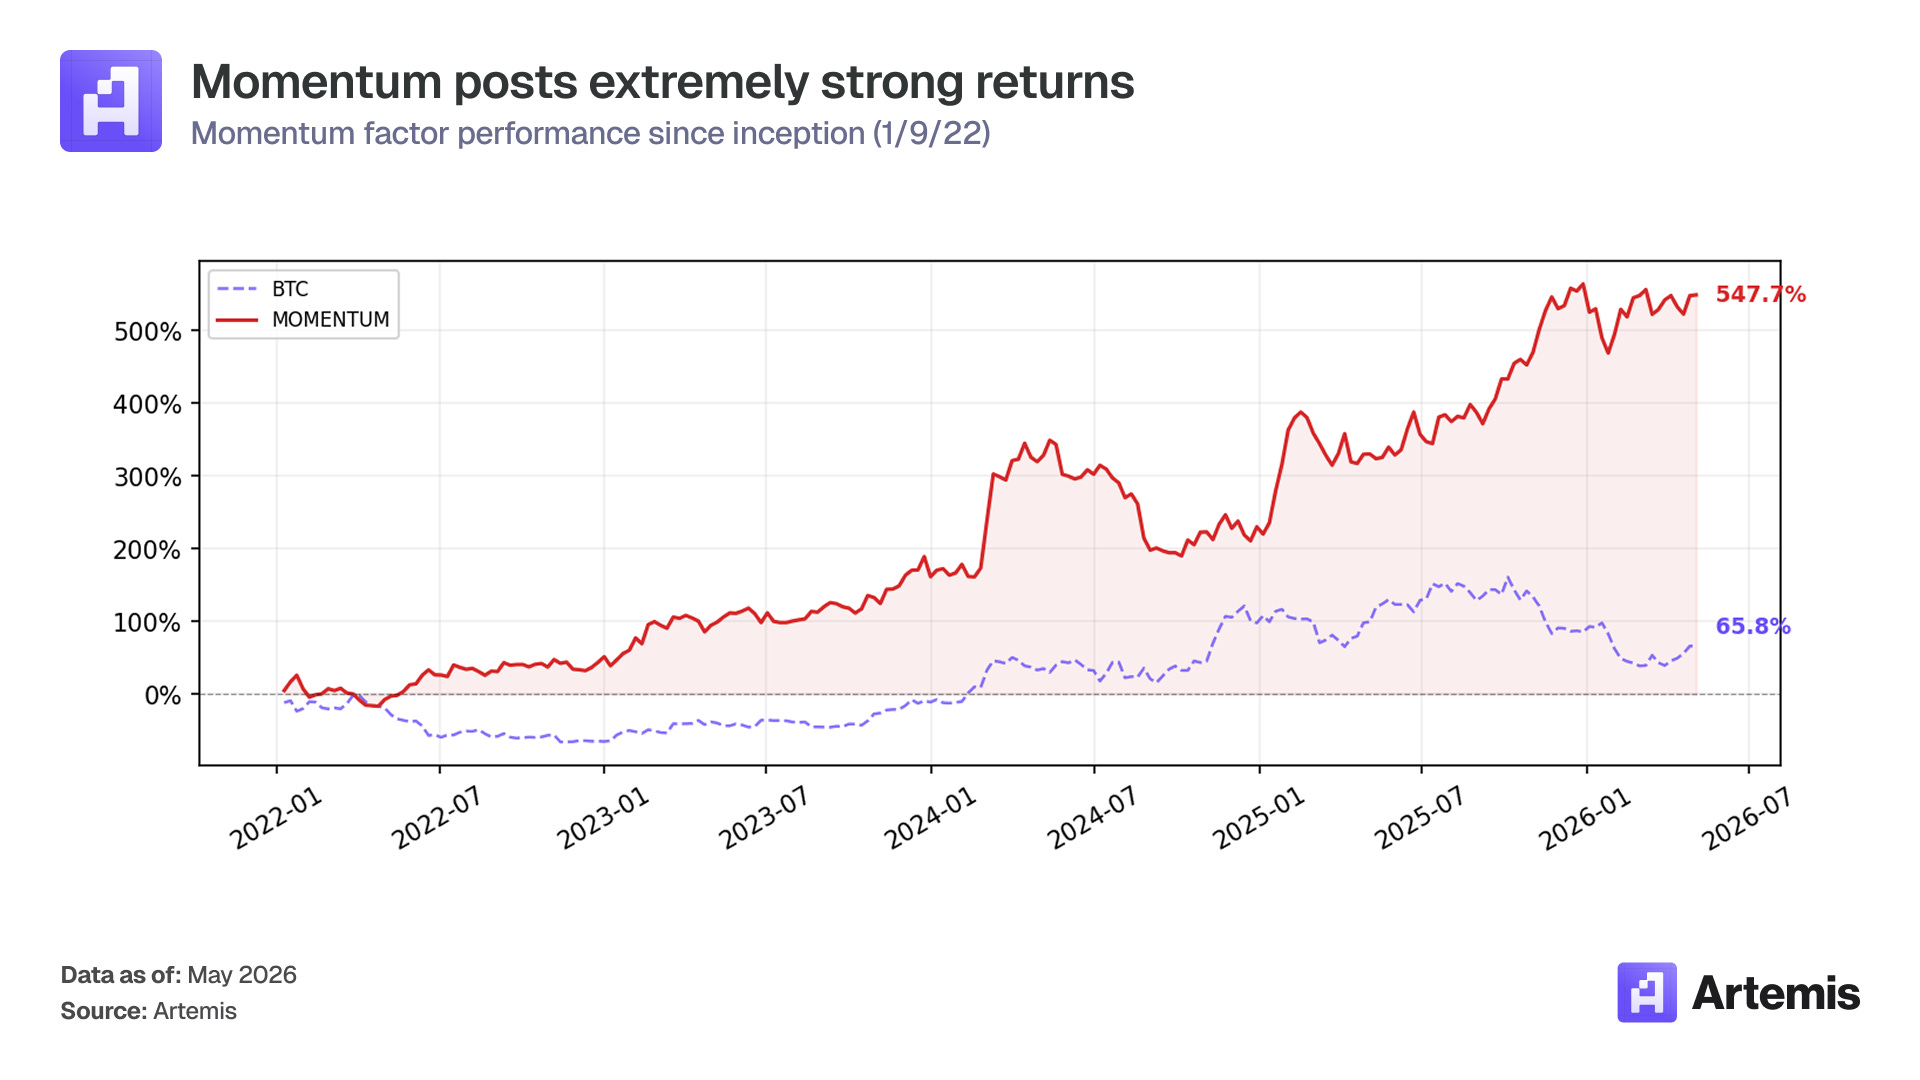
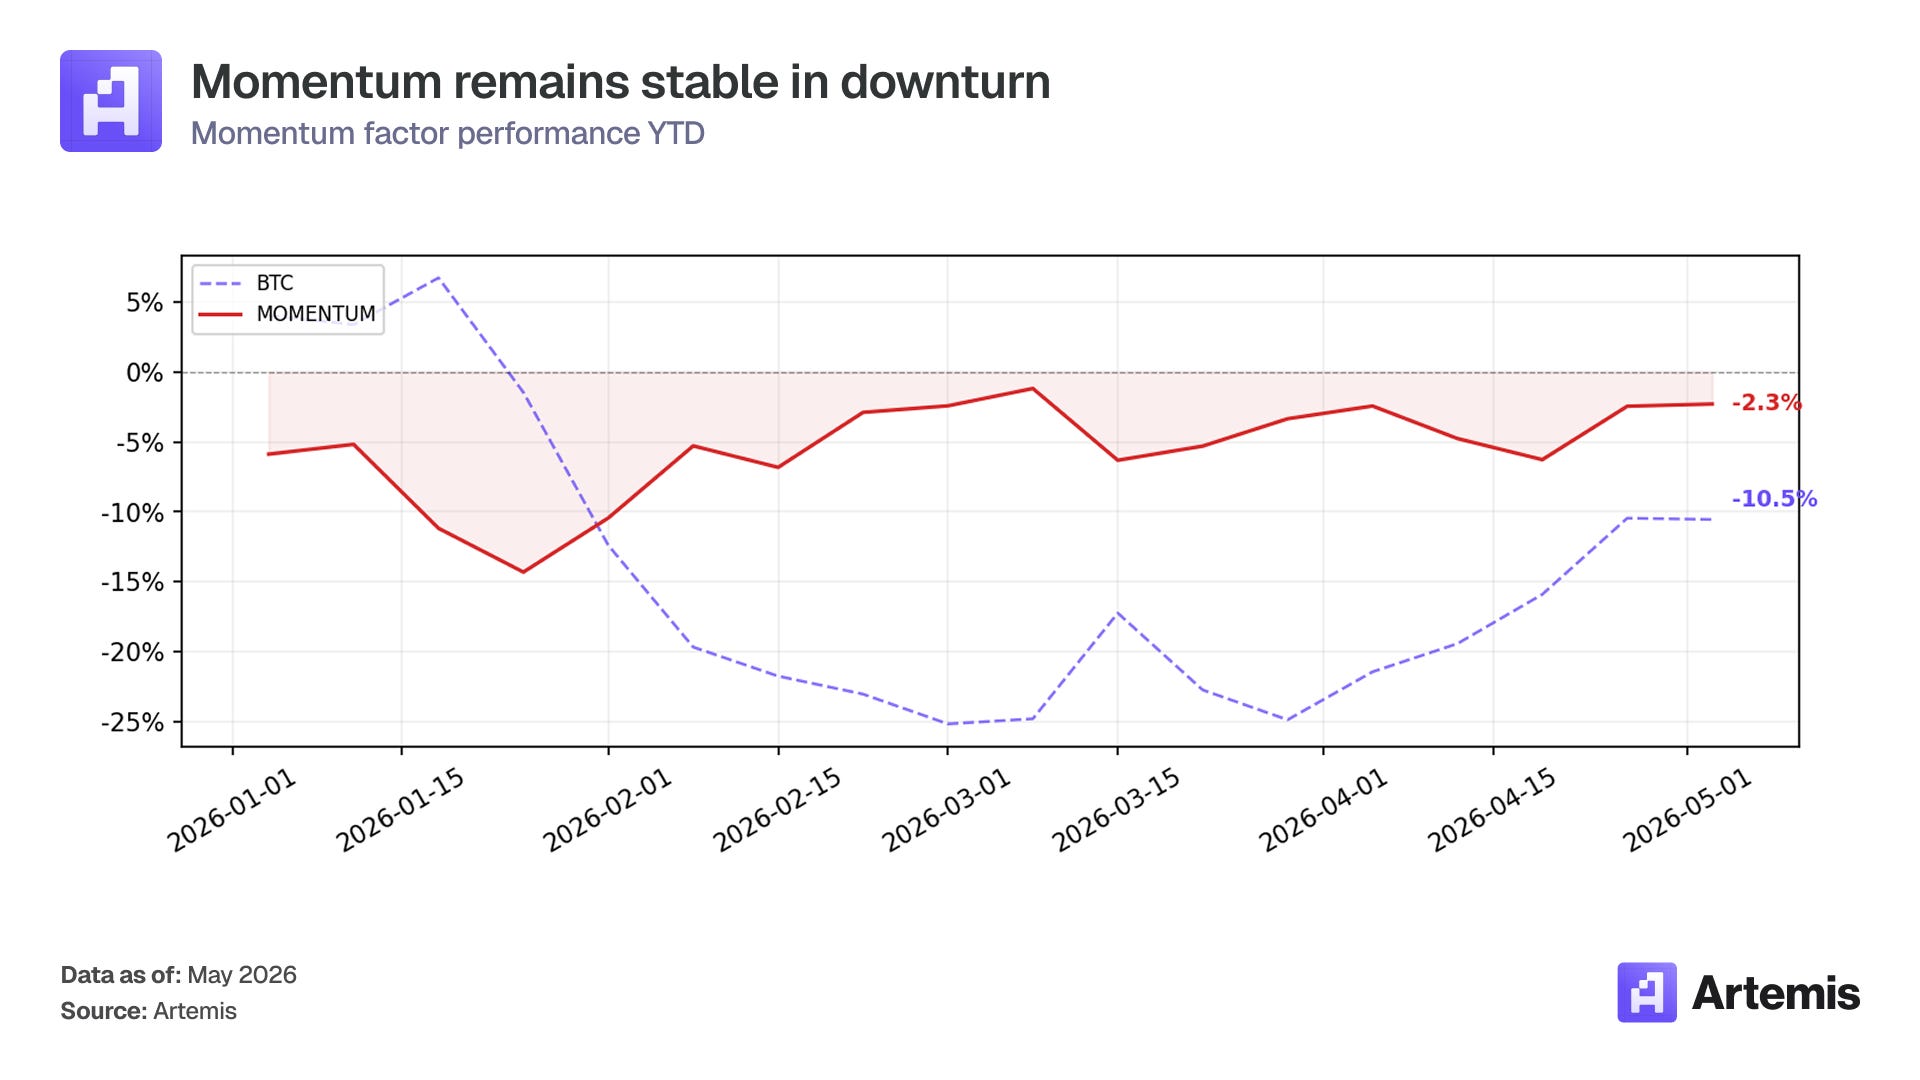
Momentum returned +0.9% in April, a marginal positive after March’s -1.3%, and YTD losses stand at -2.3%. While the monthly return was modest, the factor continues to exhibit extraordinary long-run performance: 51.09% annualized return with a 1.39 Sharpe ratio since inception, the highest among all factors. The muted April return reflects a challenging environment for trend-following strategies: the sharp reversal from March’s risk-off regime meant that many of the trends momentum was positioned for reversed quickly in April. Tokens that had been declining (and were therefore shorted) rallied, while some prior winners stalled.
Despite the flat monthly return, momentum’s -2.3% YTD loss is relatively mild compared to the market factor’s -14.2% and BTC‘s -10.5%, showing the factor’s ability to limit downside.
Top 5 Winners & Losers for April
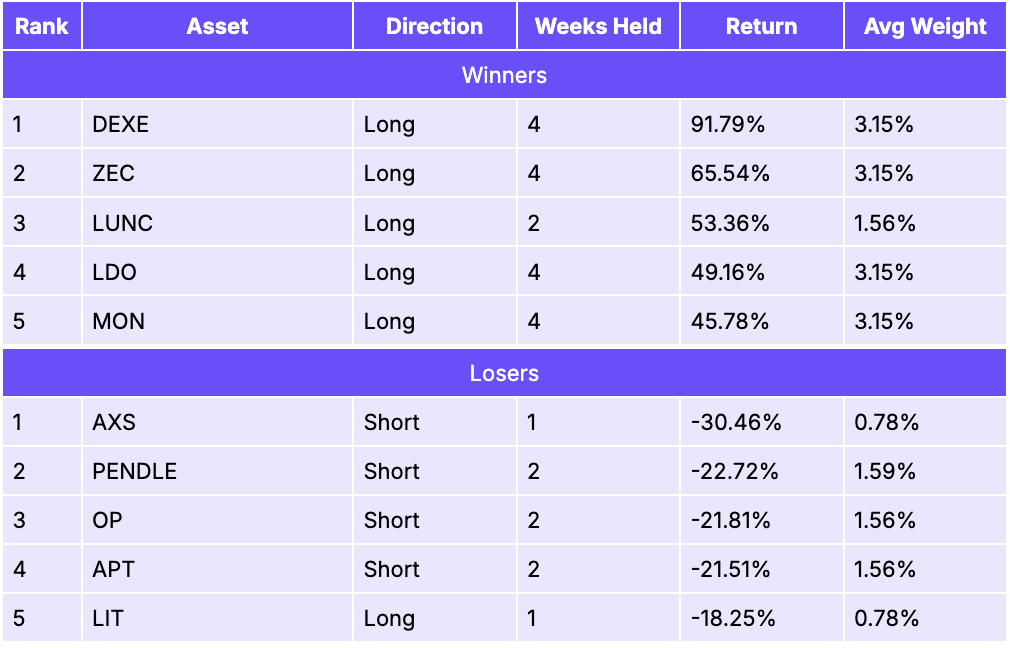
DEXE (+91.8% as a long) was once again the top contributor across multiple factors. The momentum signal correctly identified DEXE’s strong uptrend early, capturing the bulk of its April rally (see SMB commentary). ZEC (+65.5% as a long) was the second-best performer, capturing Zcash’s explosive rally driven by the catalysts described in the SMB section. LUNC (+53.4% as a long) contributed as the burn-driven rally continued (see SMB commentary) and the Cosmos SDK v0.53 integration going live.
On the losing side, AXS (-30.5% as a short) was the largest detractor, rallying against the factor’s short positioning as gaming tokens benefited from the broader altcoin recovery. PENDLE (-22.7% as a short) hurt the factor meaningfully. The DeFi yield protocol rallied over 20% in mid-April as its new sPENDLE liquid staking model (launched January 2026) and ~$34 million annualized revenue attracted renewed investor interest, including from high-profile buyers like Arthur Hayes.
Growth
Construction
Equal-weighted long-short: composite score combining z-scores of 2-week trailing fee growth (pct change) and DAU growth (pct change). Long top 50% composite score, short bottom 50%. Eligibility requires DAU > 100 and weekly fees > $500. 30 assets (15 per leg).
Performance Metrics

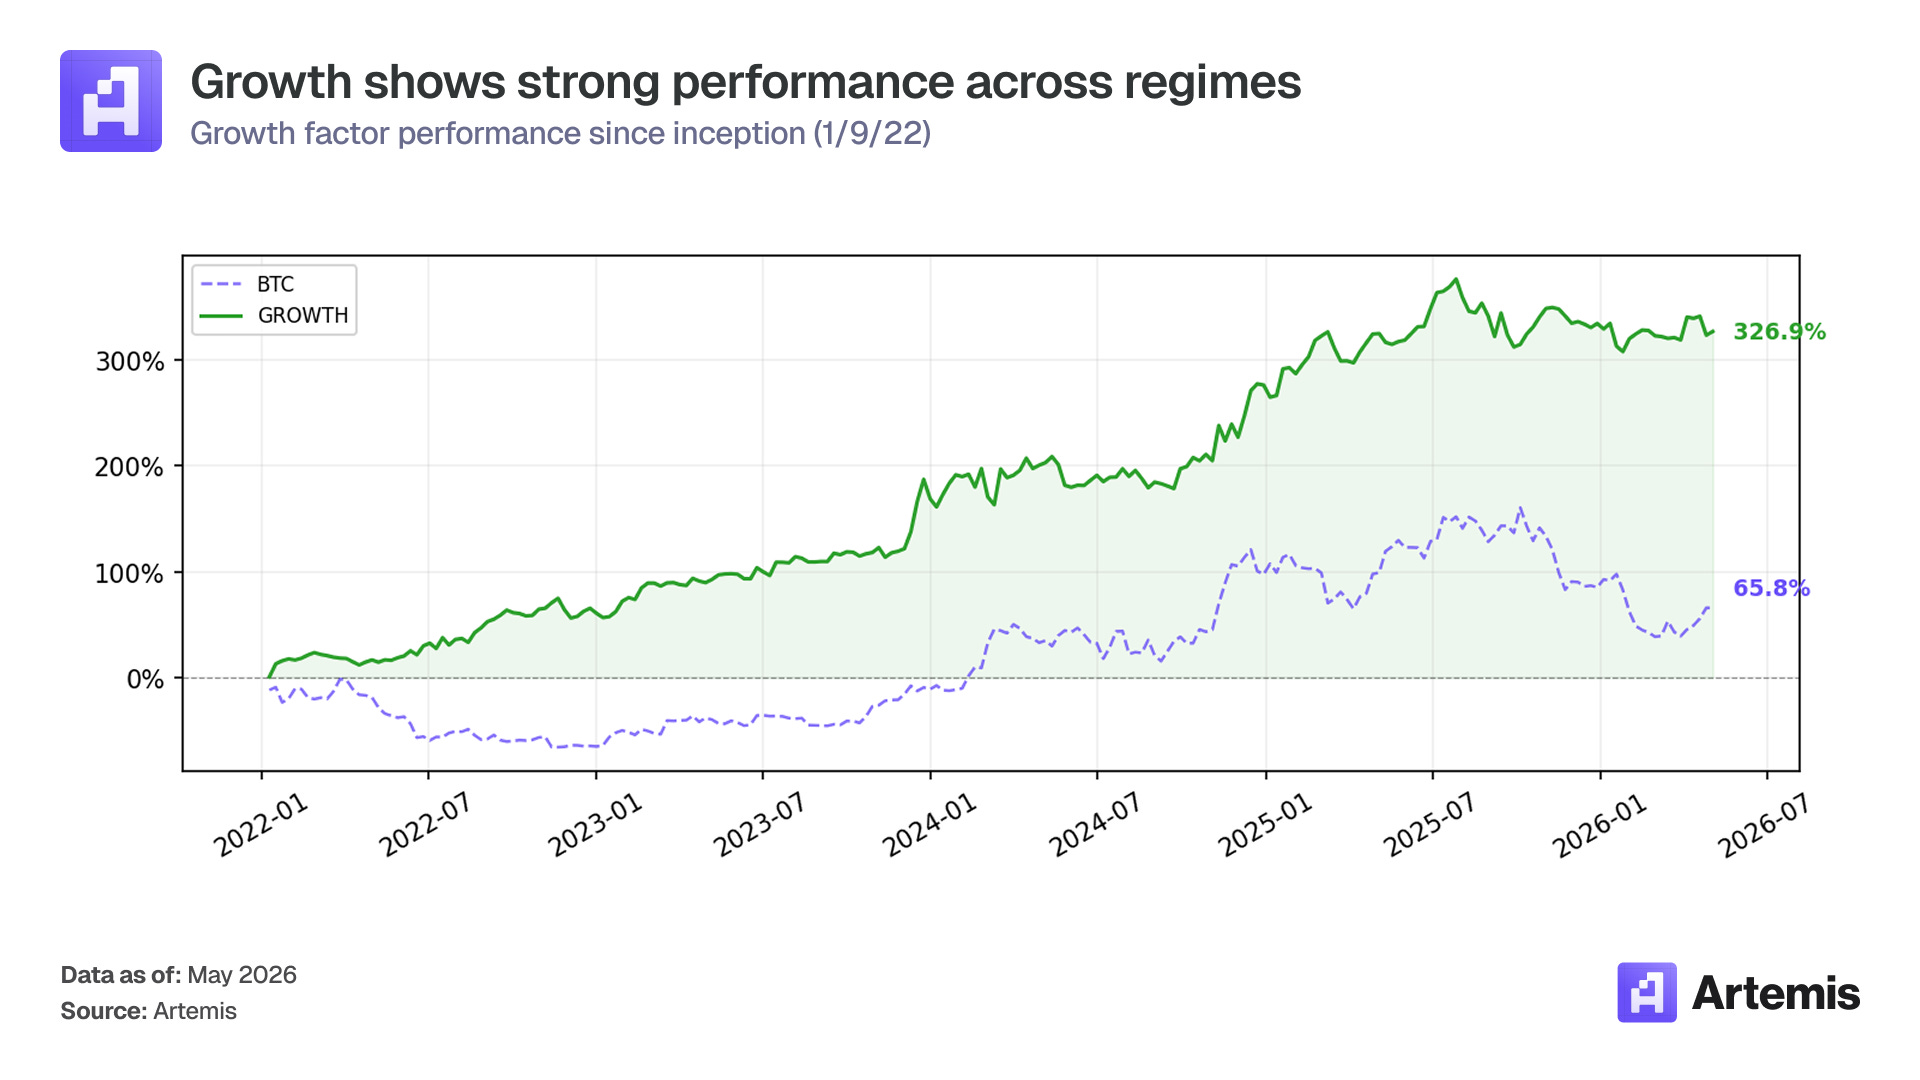
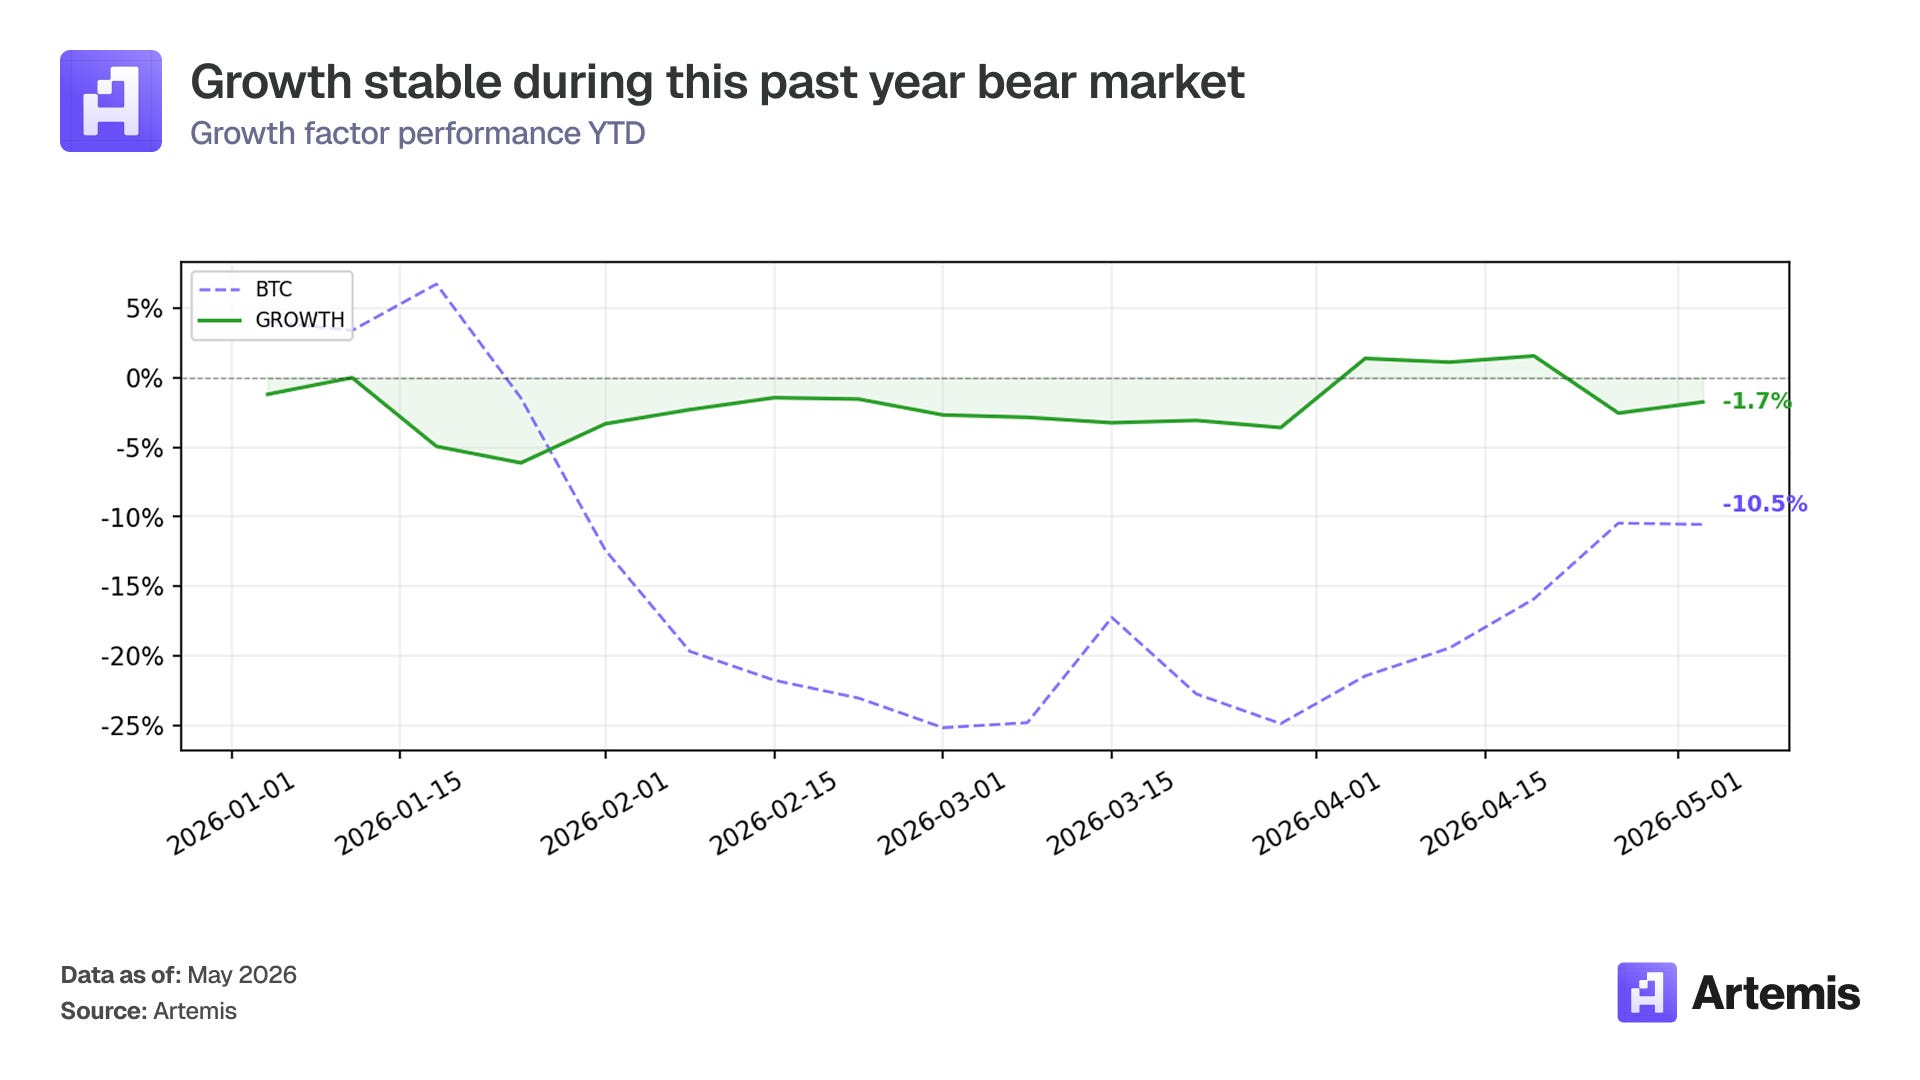
Growth returned +1.1% in April, bringing YTD losses to -1.7%. The factor continues to display the lowest volatility among long-short factors at 23.0% annualized, reflecting the stability of its underlying signals (trailing fee growth and DAU growth). The positive monthly return represents a return to profit that was previously challenged in the risk-off environment when fundamental growth metrics provided less differentiation.
The Sharpe ratio of 1.53 and Sortino ratio of 2.82 since inception remain the highest of any factor, indicating that Growth’s quality-driven signal delivers the best risk-adjusted returns over full cycles. The max drawdown since inception of -14.4% is the shallowest among long-short factors after Value, reflecting the stability of the growth signal.
Top 5 Winners & Losers for April
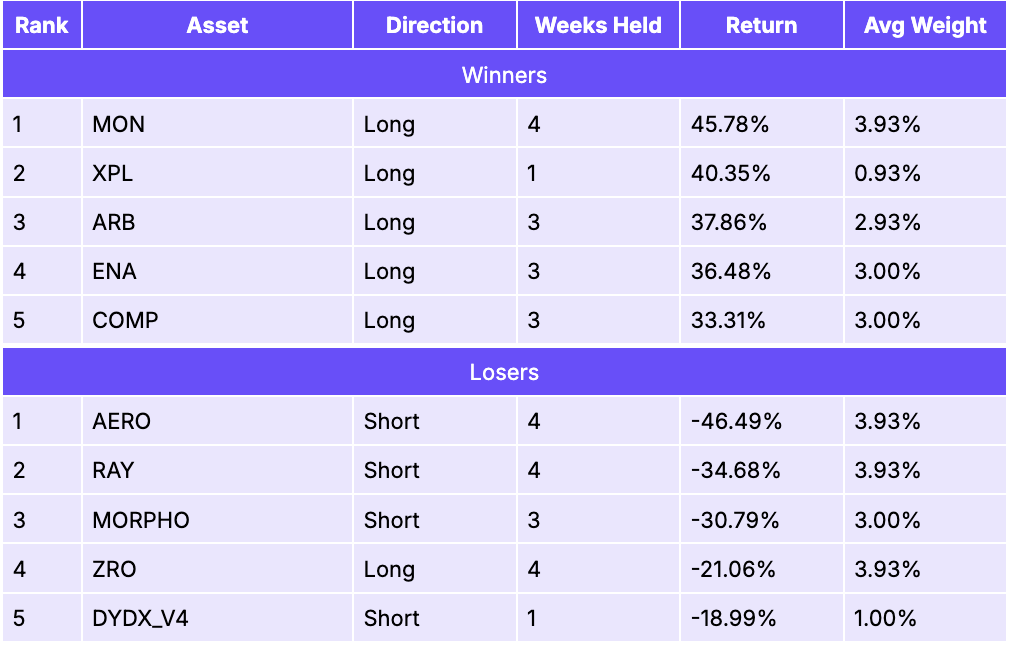
MON (+45.8% as a long) was the top performer, correctly identified by the growth signal as exhibiting accelerating fees and user activity. XPL (+40.4% as a long) contributed over one week of positioning. ARB (+37.9% as a long) rallied alongside the L2 recovery, with Arbitrum’s fee growth confirming its position as the leading L2 by DeFi activity. ENA (+36.5% as a long) surged as Ethena’s synthetic dollar protocol continued to gain traction. Arthur Hayes’s visible accumulation of ENA tokens and growing speculation around a potential Bitwise ETF filing for ENA supported the rally.
On the losing side, AERO (-46.5% as a short) was the largest detractor. Despite Aerodrome’s strong fundamentals (see SMB commentary), the growth factor shorted it based on its composite ranking. RAY (-34.7% as a short) similarly rallied against the short position as Raydium’s Solana DEX volumes surged. MORPHO (-30.8% as a short) gained as the DeFi lending sector recovered. ZRO (-21.1% as a long) was a notable long-side loser as LayerZero’s price declined despite its earlier announcement of a Layer-1 blockchain backed by Citadel Securities, ARK Invest, and Google Cloud, as the initial excitement faded.
Fundamentals 1
Construction
Equal-weighted long-short quintile portfolio: composite score combining rank z-scores of DAU growth, inverted active revenue share, revenue stability, and MC/fees mean reversion. Long top quintile (~12 assets), short bottom quintile (~12 assets).
Performance Metrics
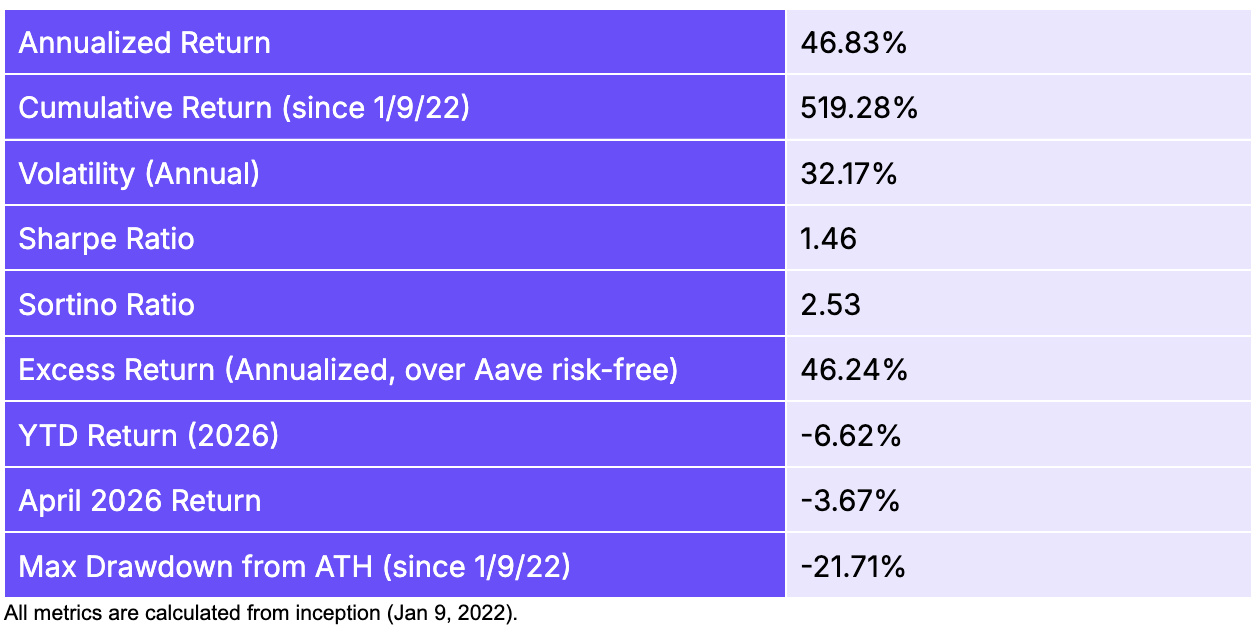
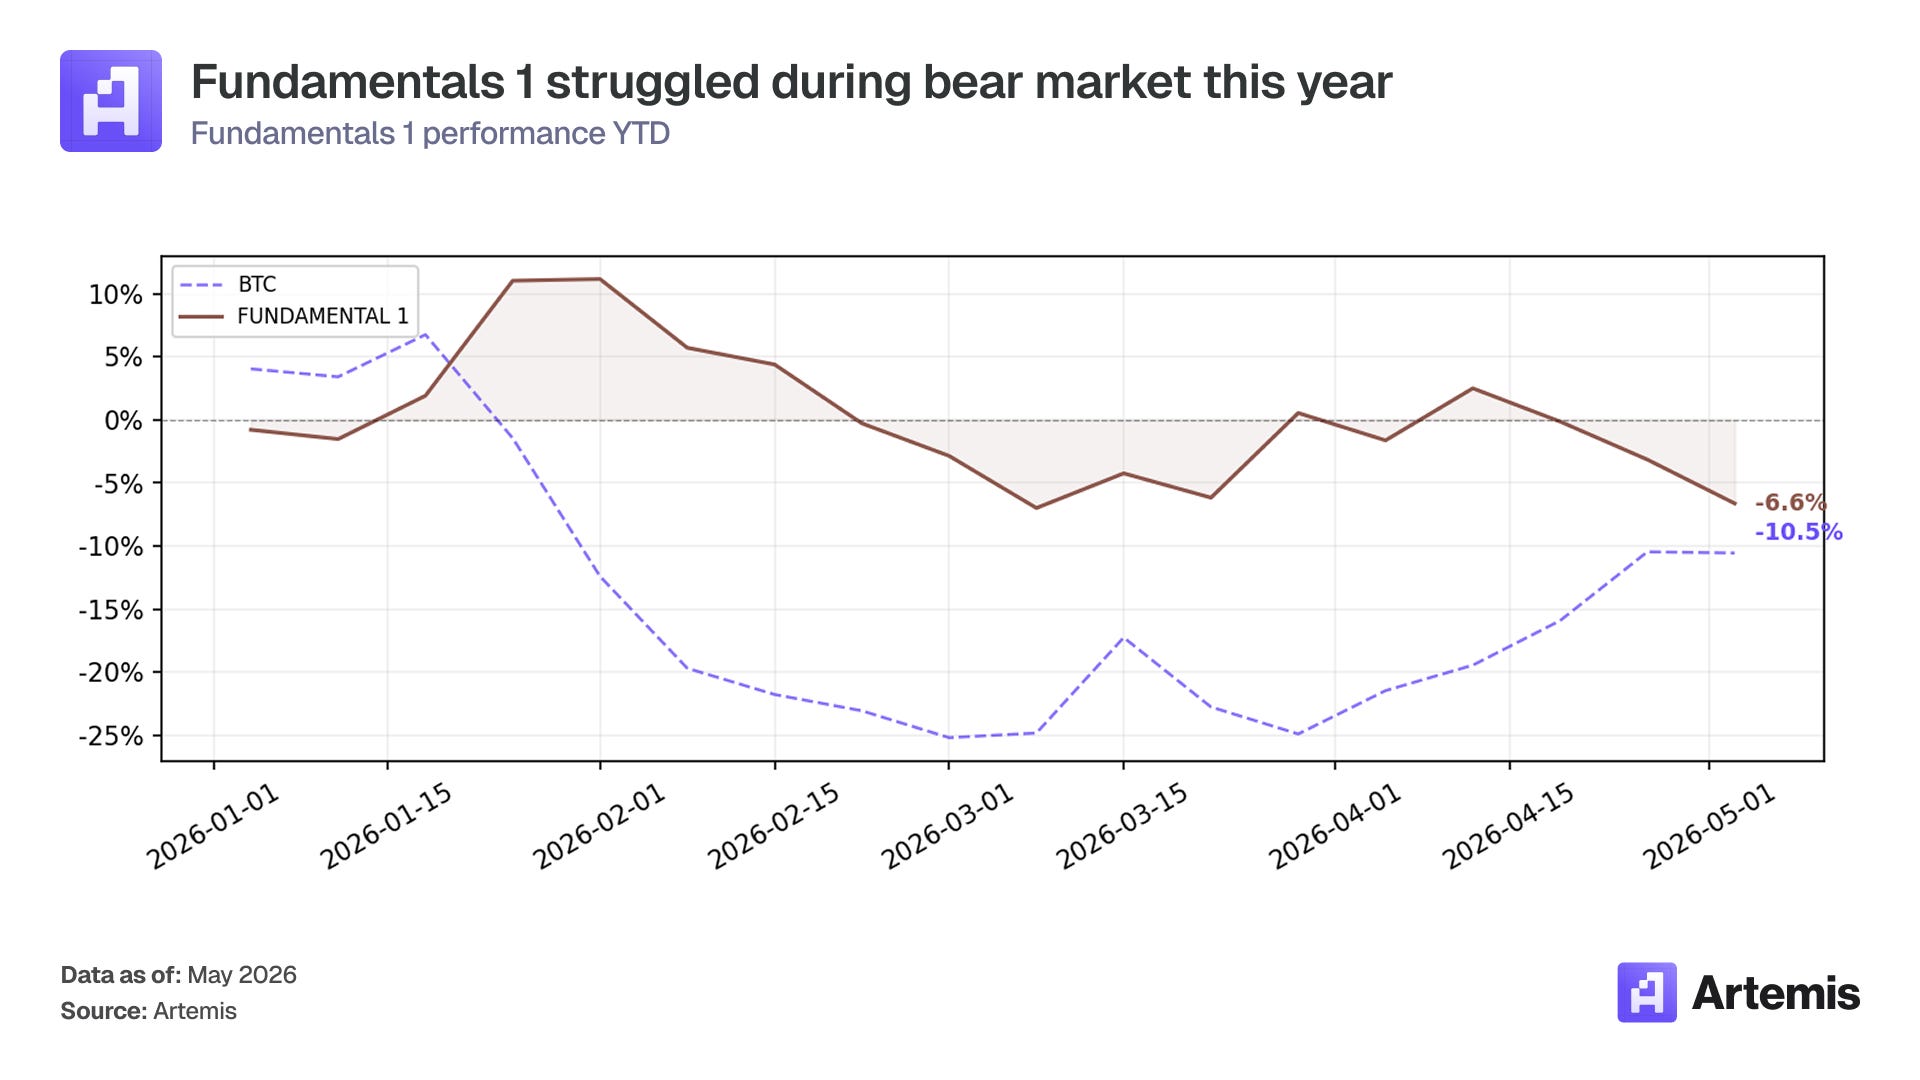
Fundamentals 1 returned -3.7% in April, the only factor to post a negative return during the month. YTD losses now stand at -6.6% and the max drawdown since inception is -21.7%. This underperformance during a strong market rally is attributable to the factor’s concentrated short positions in tokens that experienced unexpected reversals.
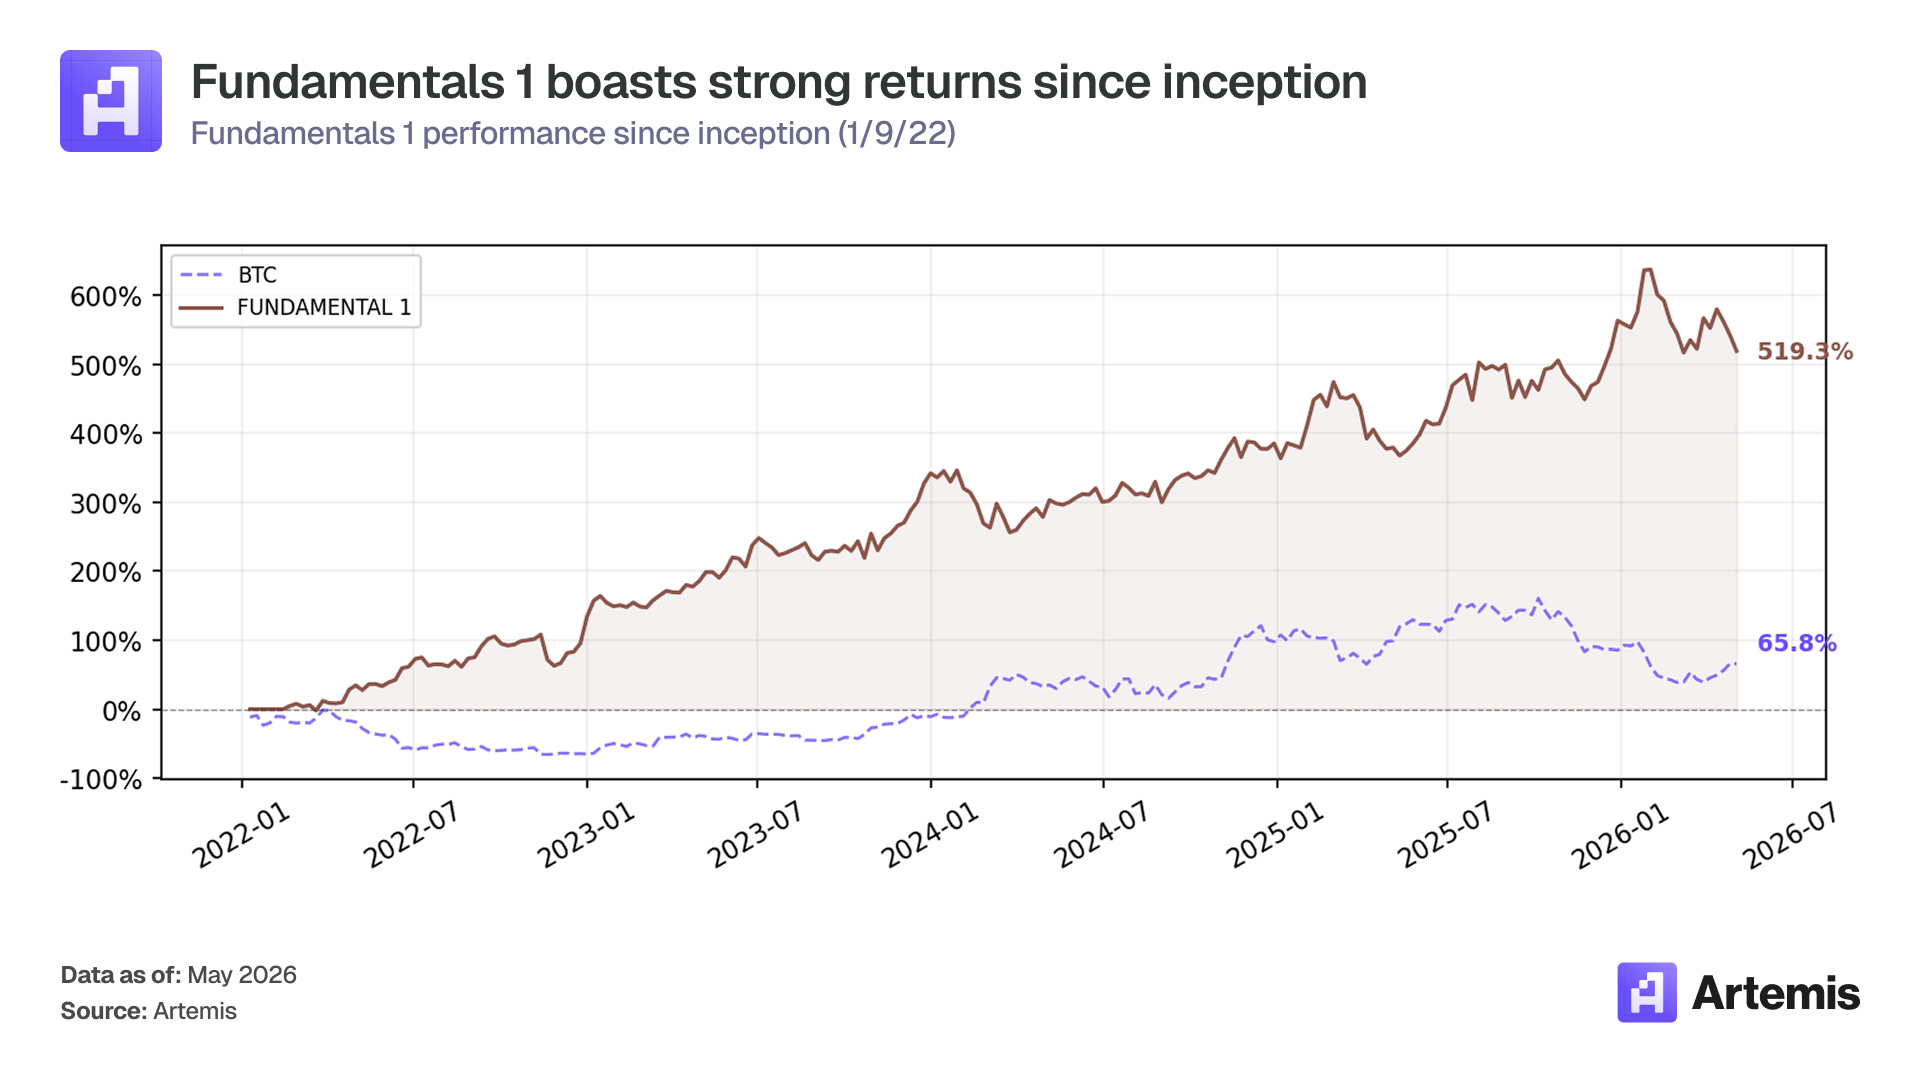
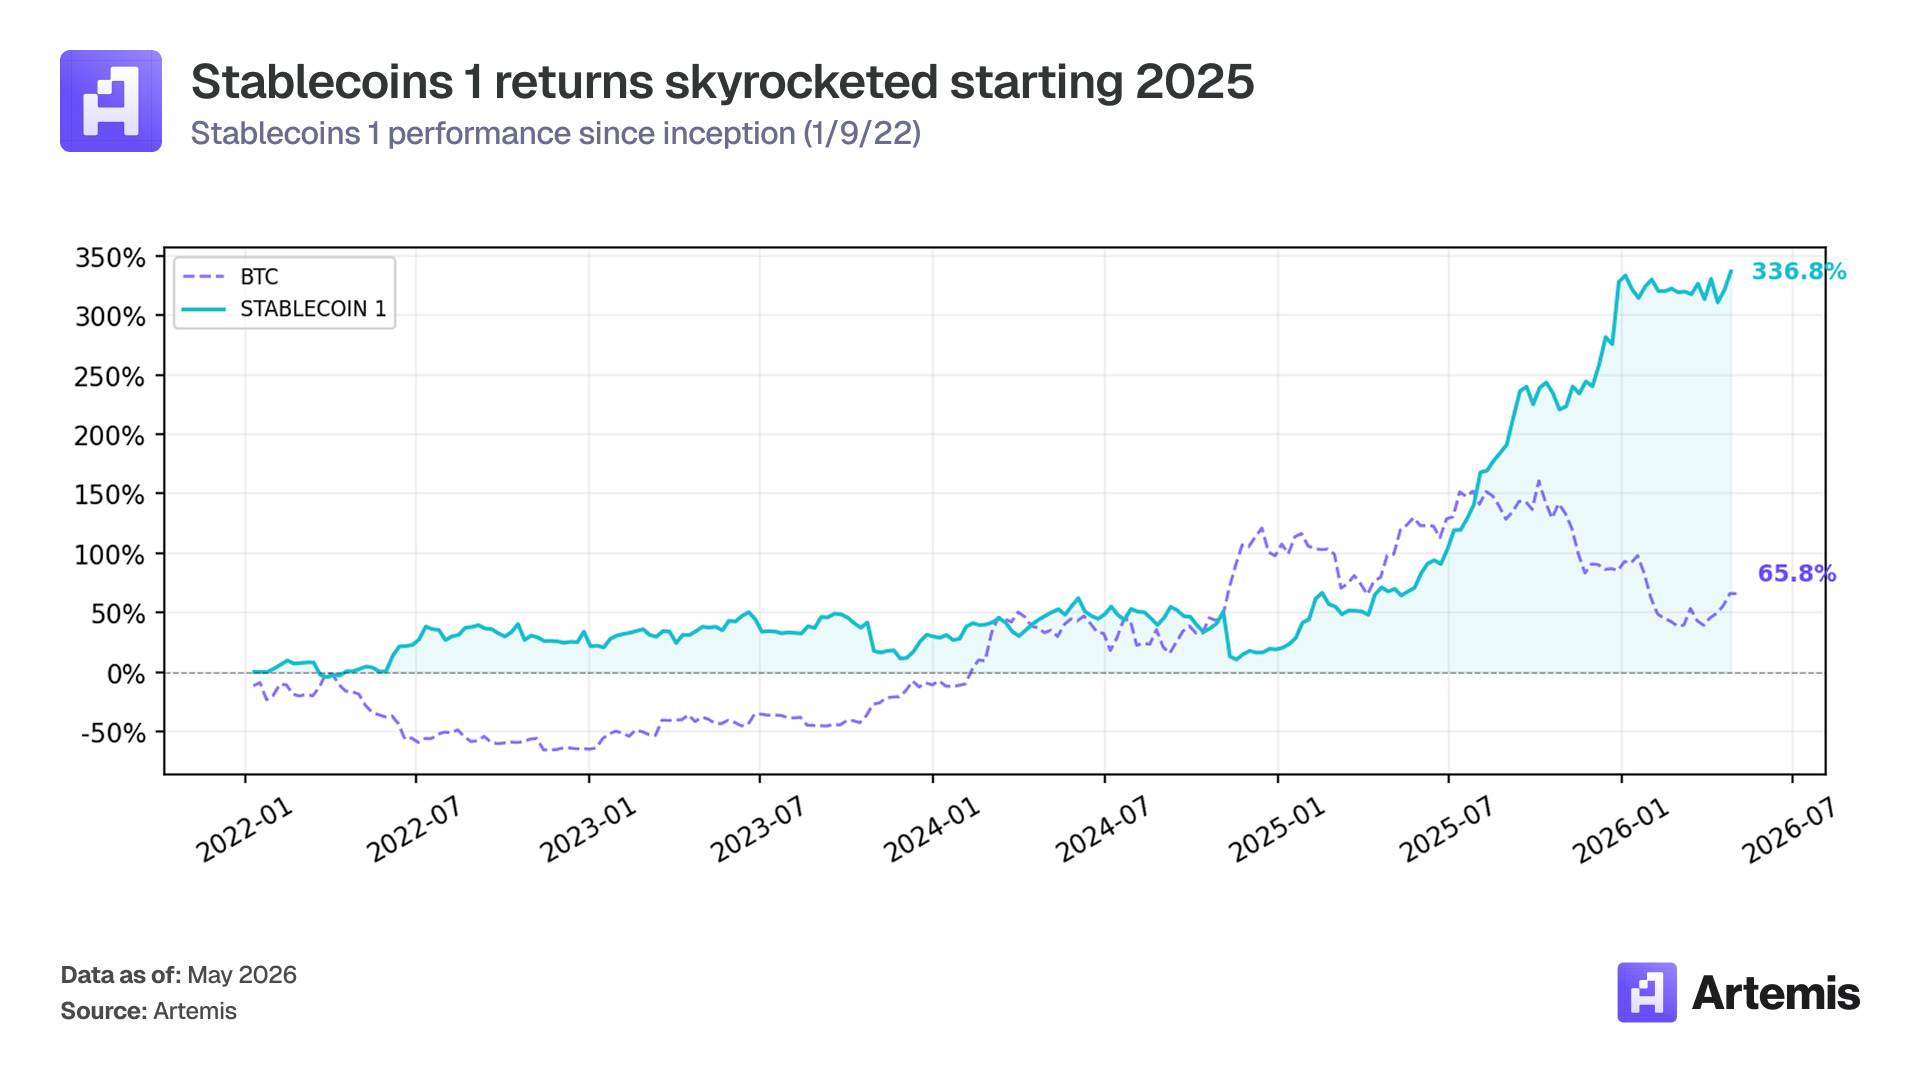
Despite the challenging month, the factor retains the second-highest annualized return (46.8%) and one of the best Sharpe ratios (1.46) since inception. The cumulative return of 519.3% compared to BTC‘s 65.8% highlights the long-term value of the composite fundamental signal.
Top 5 Winners & Losers for April
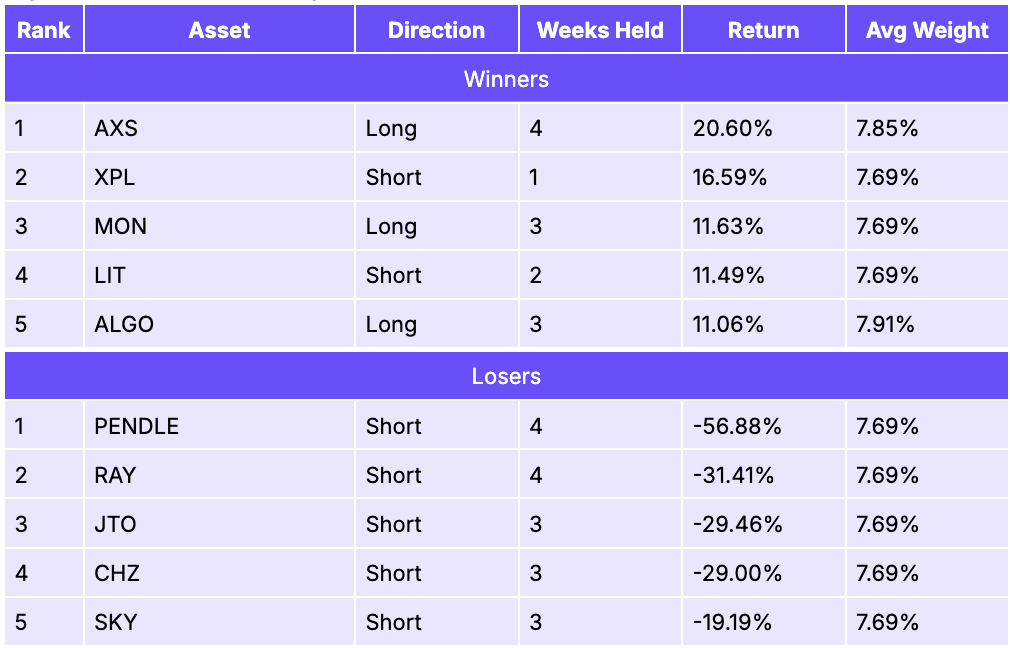
AXS (+20.6% as a long) was the top contributor, with the gaming token’s fundamental scores correctly positioning it on the long side as Axie Infinity’s fee generation and user activity showed improvement. ALGO (+11.1% as a long) continued to benefit from the SEC’s digital commodity declaration (see Value commentary).
On the losing side, PENDLE (-56.9% as a short) was by far the largest detractor (see Momentum commentary). The factor’s short positioning was based on PENDLE’s composite fundamental score, but the market rewarded its strong revenue generation with a sharp re-rating. RAY (-31.4% as a short) rallied as Raydium’s dominance of Solana DEX trading volumes continued to grow. JTO (-29.5% as a short) gained alongside the broader Solana ecosystem recovery. CHZ (-29.0% as a short) rallied on World Cup momentum (see Value commentary).
Stablecoins 1
Construction
Equal-weighted long-short quintile portfolio: composite score combining rank z-scores of stablecoins flow. Long top quintile (~3-4 chains), short bottom quintile (~3-4 chains).
Performance Metrics

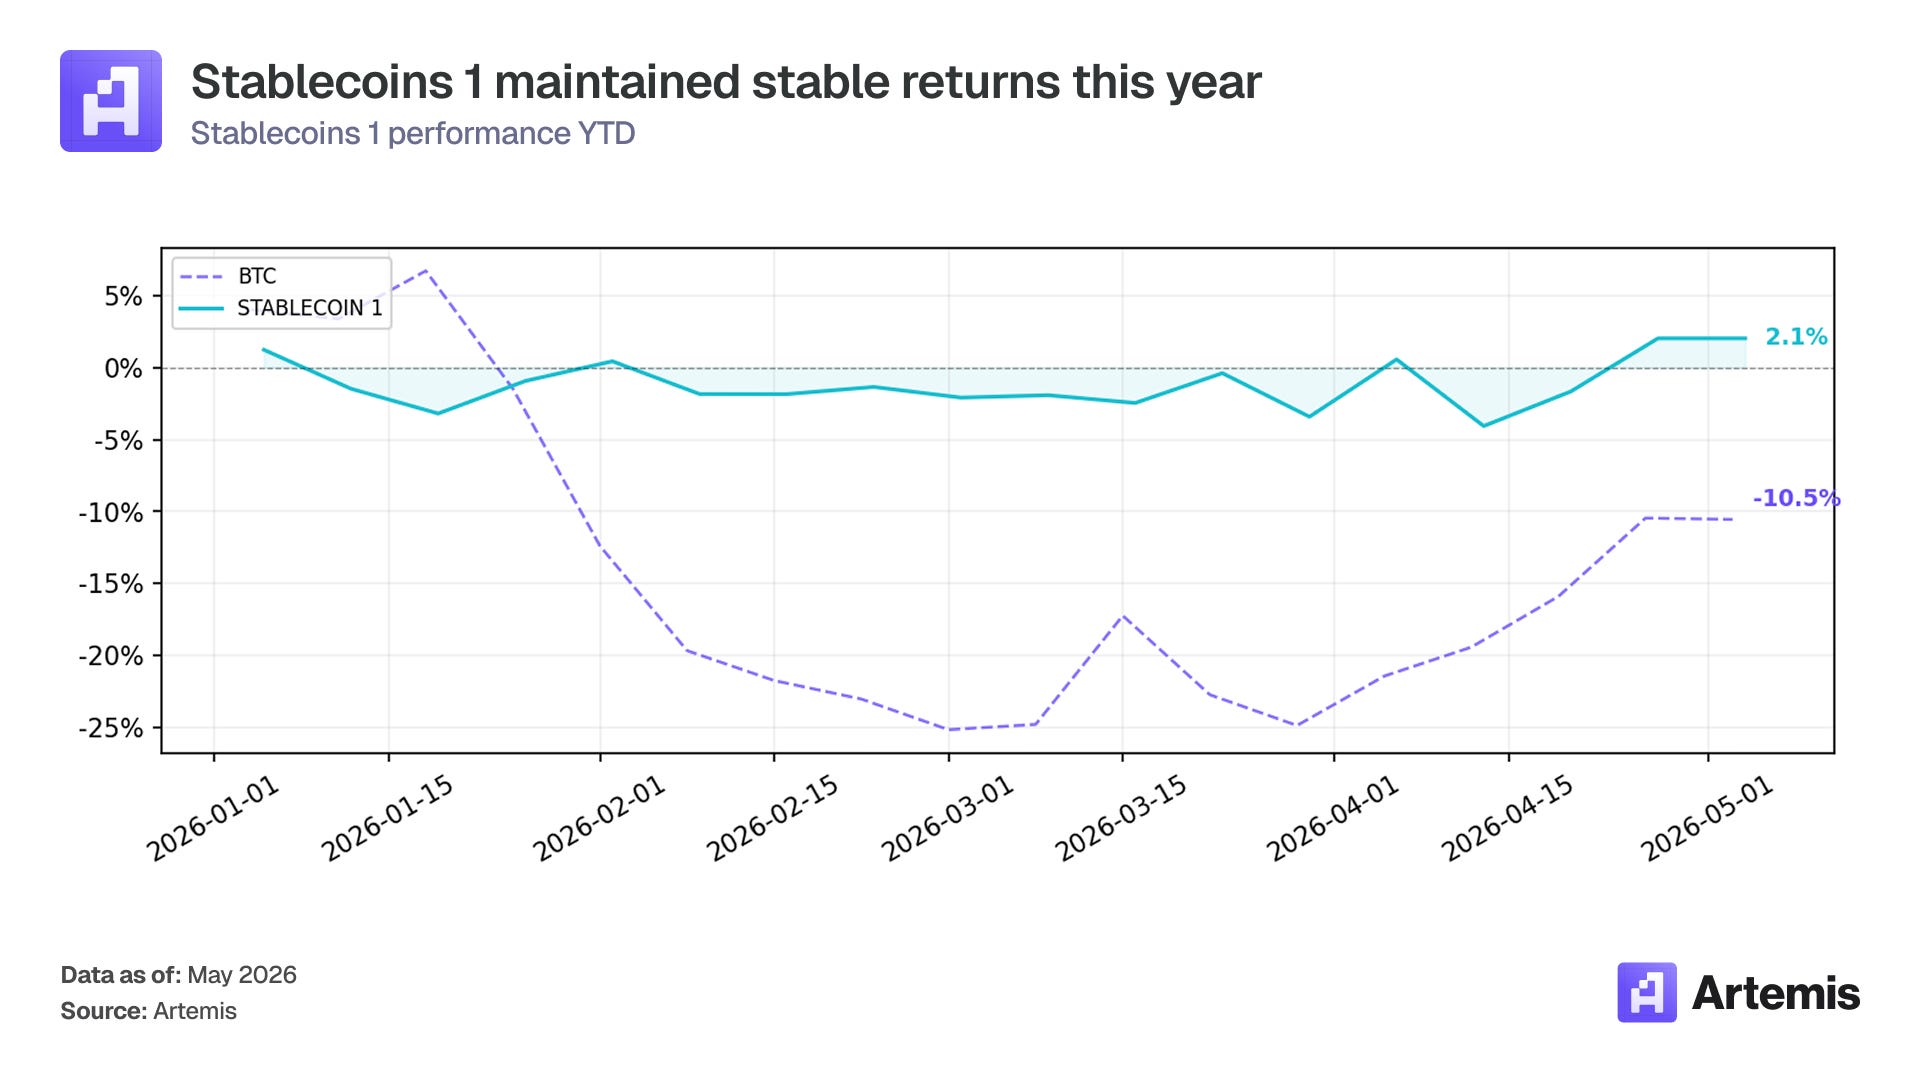
Stablecoins 1 returned +5.7% in April, bringing its YTD return to +2.1%, one of only two factors (alongside Value) positive for the year. The max drawdown since inception of -31.8% reflects earlier drawdowns in the strategy’s history, though the factor has been on a strong run since mid-2025. The factor’s annualized return of 39.6% and Sharpe of 1.26 since inception demonstrate that stablecoin flows are a powerful signal for predicting relative chain performance.
Top 5 Winners & Losers for April
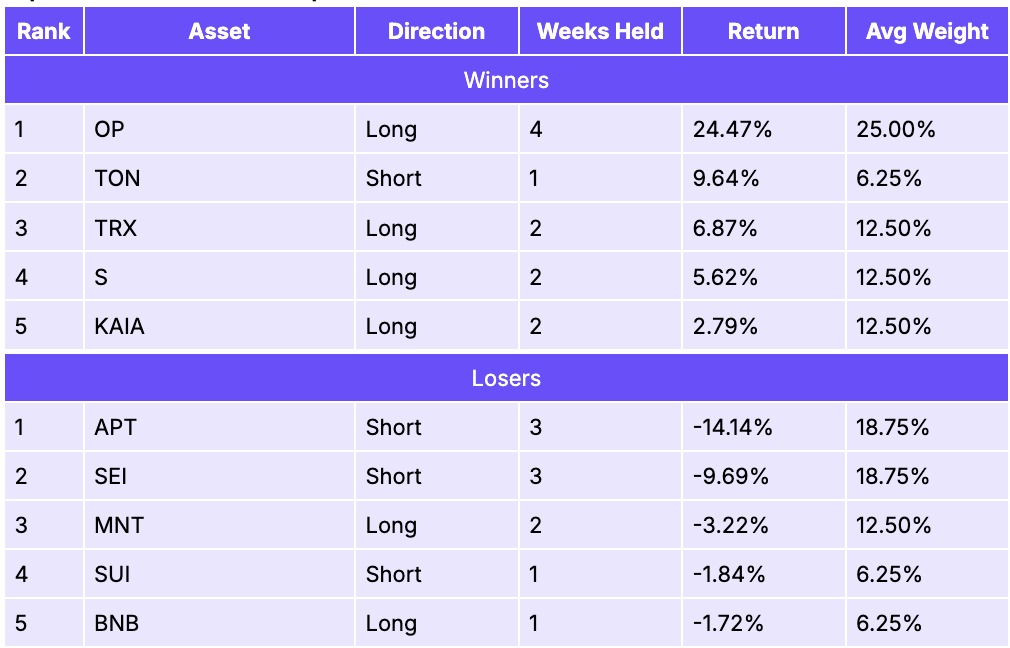
OP (+24.5% as a long) was the top contributor by a wide margin. Optimism attracted significant stablecoin inflows in April as the broader L2 ecosystem recovery took hold. As one of the leading Ethereum L2s, Optimism’s Superchain vision, a network of interconnected OP Stack rollups, continued to attract new chain deployments, driving stablecoin deposits into its ecosystem. TON (+9.6% as a short) contributed from the short leg as Toncoin experienced stablecoin outflows. TRX (+6.9% as a long) continued to capture the stablecoin transfer narrative, with Tron remaining the dominant network for USDT transfers globally.
On the losing side, APT (-14.1% as a short) was the largest detractor, as Aptos rallied despite showing negative stablecoin flow trends. The broader market recovery lifted all chains in April, making it harder for the stablecoin flow signal to fully differentiate.
Key Findings & Conclusion
April was a recovery month that tested the crypto factor framework in the opposite direction from the prior three months. After limiting losses during the February-March drawdown, the long-short factors naturally lagged the broad market during recovery. This is by design: the short legs that protected capital during the selloff gave back some returns as speculative assets bounced indiscriminately.
Several cross-factor themes emerged in April. The DAO governance narrative continued to drive DEXE, which appeared as a top contributor in both SMB and Momentum for the second consecutive month. Privacy coins saw explosive demand, with ZEC‘s rally driven by the SEC clearance, Grayscale’s spot ETF filing, and the growing narrative that AI surveillance will increase demand for financial privacy. DeFi yield protocols recovered sharply: PENDLE‘s rally (fueled by its sPENDLE tokenomics overhaul and strong revenue) was the single largest loss for Fundamentals 1, while Aerodrome‘s cross-chain expansion plans attracted institutional accumulation. The LUNC burn narrative gained renewed steam with over 2 billion tokens destroyed in April and a major network upgrade vote on the horizon.
Value and Stablecoins 1 remain the standout YTD performers at +13.3% and +2.1% respectively, while all other factors, including the market index at -14.2% and BTC at -10.5%, remain negative for the year. The framework’s cumulative value is best measured over the full backtest period: Momentum has returned 547.7% since inception versus BTC‘s 65.8%, Fundamentals 1 has returned 519.3%, and Growth has returned 326.9%.
Looking ahead, the key question is whether April’s recovery has legs or whether the ongoing Iran conflict and elevated oil prices will reassert downward pressure. If the risk-on environment persists, long-short factors may continue to lag the market in the near term, but their compounding advantage over full cycles remains compelling.
If you have any questions, feel free to reach out to team@artemis.xyz or shoot us a DM on X.com at https://x.com/artemis
Disclosure: This material is provided for informational purposes only and does not constitute investment advice, financial advice, trading advice, or any other form of advice. The views expressed are those of the authors and should not be relied upon as a recommendation to buy, sell, or hold any asset. The authors or affiliated entities may hold positions in the assets discussed. You should conduct your own research and consult appropriate financial professionals before making any investment decisions
 | A guest post by
|