

Market Overview
Risk assets went nowhere. The composition underneath changed a lot. Bitcoin finished at $64,444, down 0.7%. Ethereum was up 0.6%.
The six-week ETF bleed finally stopped:
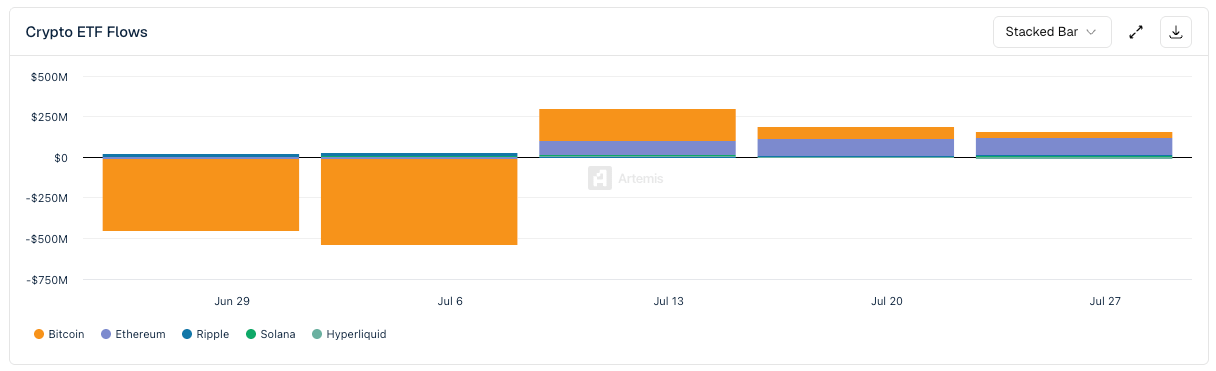
Spot bitcoin ETFs: +$75.5M (Jul 13-17), +$33.9M (Jul 20-24)
Bitcoin ETF AUM: $78.9B
Ethereum ETFs: roughly +$104M in each of the two recent weeks
The real repricing happened in rates. Fed hike odds for July 28-29 went from 10.7% on July 15 to nearly 35% by July 22, almost entirely because Brent pushed toward $100 on the Iran conflict.
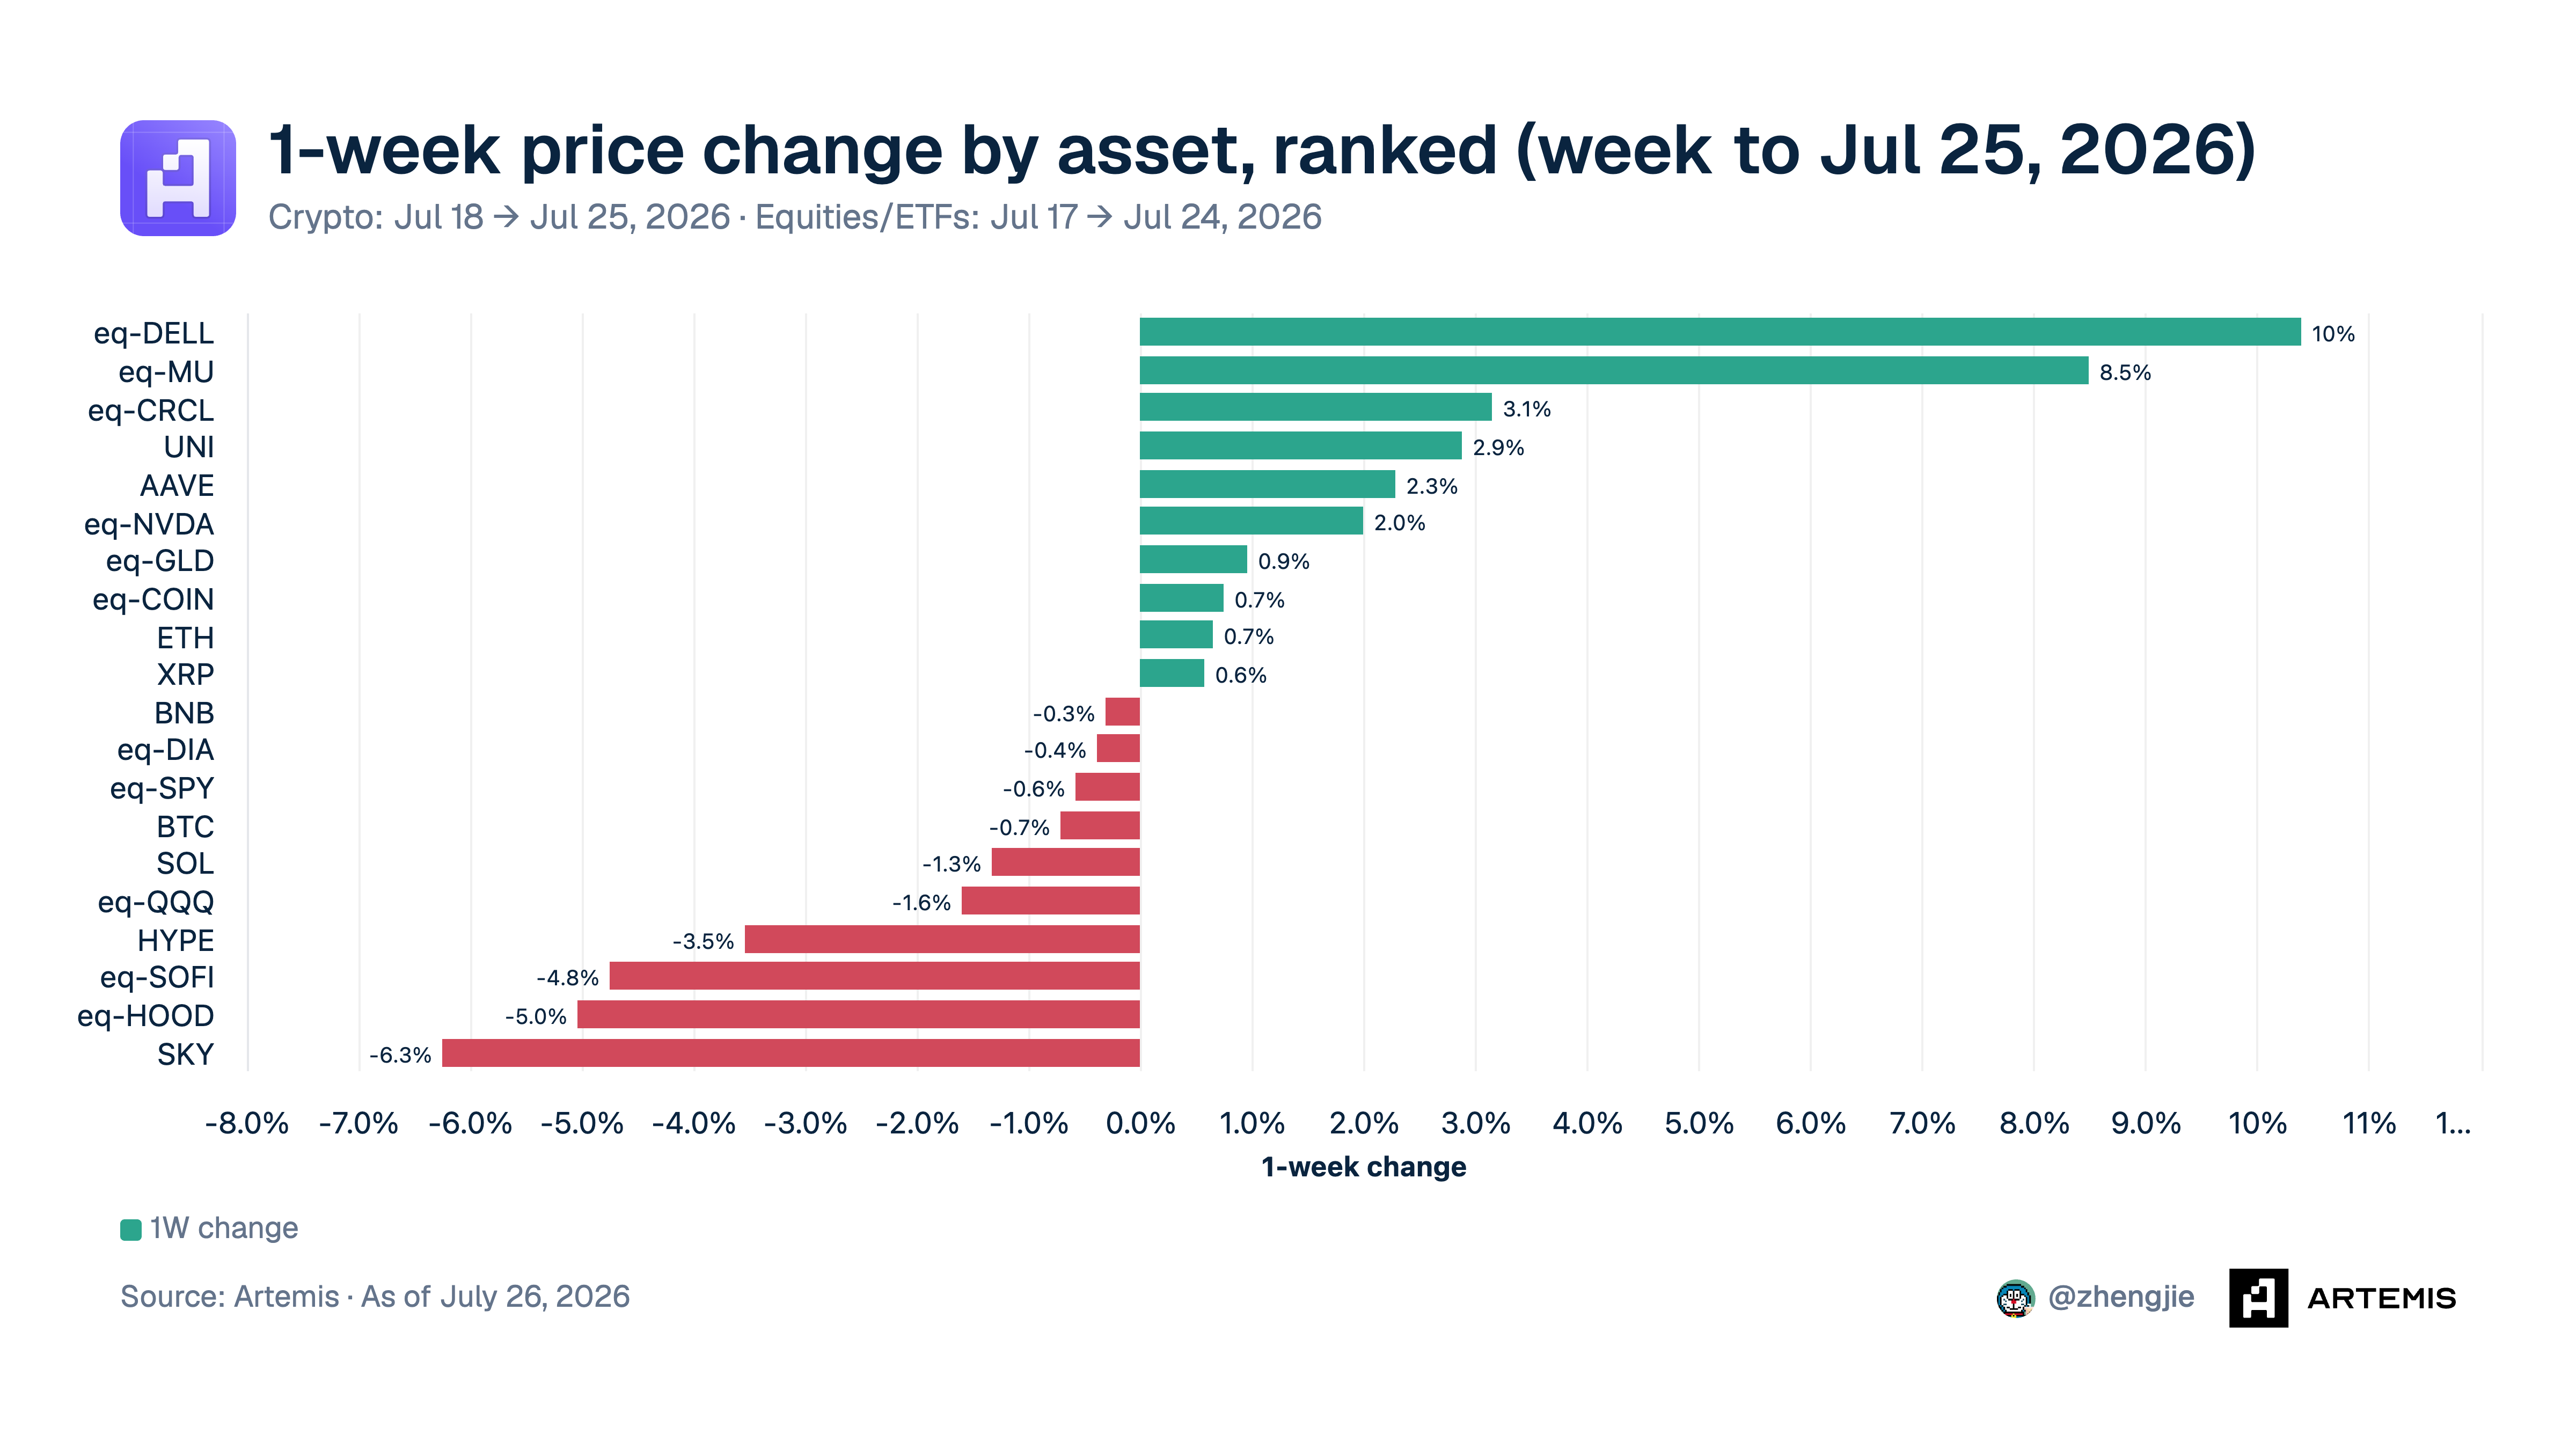
Unlike last week, semis recovered.
DELL (+10.4%) and MU (+8.5%) led the basket, a sharp reversal for memory after Micron’s 28% slide from its June highs. NVDA (+2.0%) beat the index it anchors (QQQ -1.5%). DeFi extended its run with UNI (+2.9%) and AAVE (+2.3%).
Crypto equities were mixed. CRCL (+3.2%) was the only one with a real gain. COIN (+0.75%) round-tripped its entire 9.6% CLARITY pop from July 21.
The damage sat in retail fintech: SKY (-6.2%), HOOD (-5.0%) and SOFI (-4.8%), with HYPE (-3.5%) close behind. BTC (-0.7%) and the broad tape barely moved (SPY -0.5%, DIA -0.3%).
The basket averaged +0.41% on the week, median +0.18%.
Today We Highlight:
The S&P Pantera Digital Asset Index, powered by Artemis data, tracks revenue-generating tokens and weights them by adjusted market cap
Robinhood Chain: What is actually happening under the hood
Introducing the S&P Pantera Digital Asset Index powered by Artemis
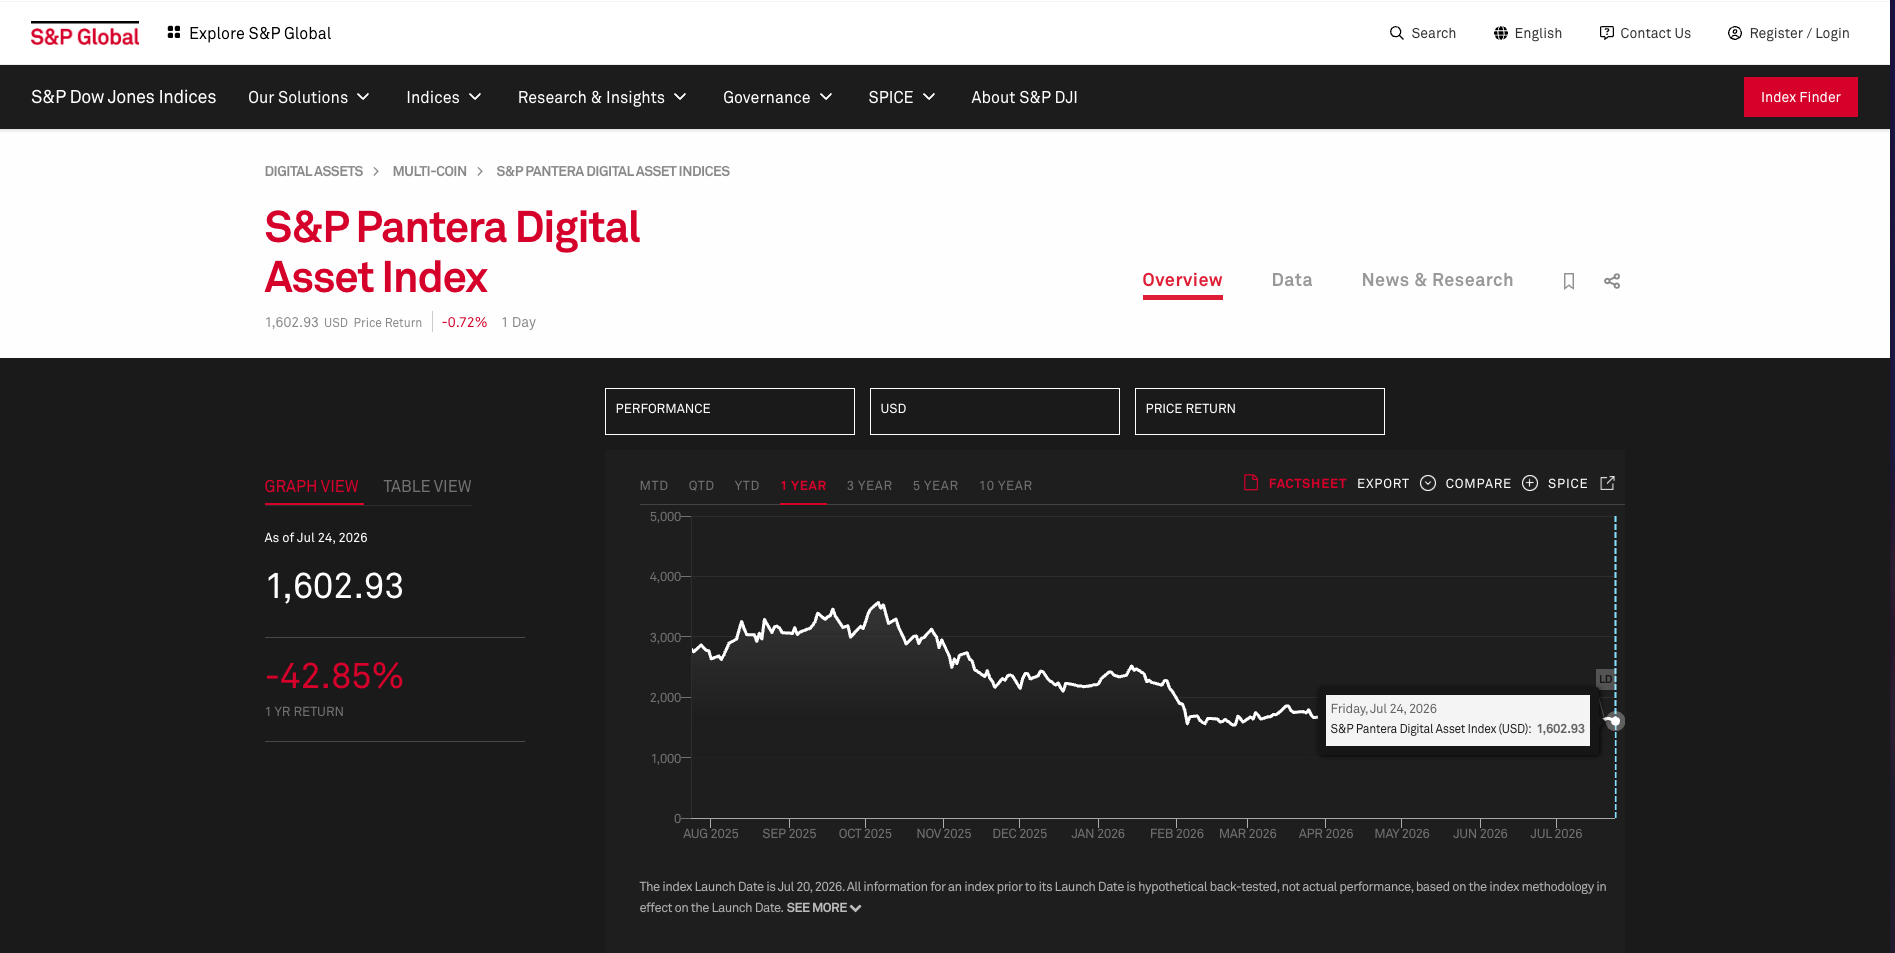
S&P Dow Jones Indices and Pantera Capital launched the S&P Pantera Digital Asset Index (SPPDA) on July 20.
It is an 18-token benchmark drawn from the S&P Cryptocurrency Broad Digital Asset Index that screens on protocol revenue, then applies capped market-cap weightings.
Artemis supplies the revenue classification, the circulating supply and outstanding supply data. Lukka supplies pricing.
The five largest constituents by weight are ETH, BNB, SOL, TRX and HYPE.
Bitcoin and XRP both fail the revenue test outright. For scale: XRP’s entire 14-year burn history is roughly $16M, against the more than $3B generated annually by the 18 tokens that qualify.
So, what?
S&P is careful about what this measures. The methodology calls protocol revenue "an objective, rules-based indicator of economic activity" and explicitly says it implies nothing about investor returns or cash flows.
Put plainly, revenue decides which tokens get in, and market cap decides how much of each you own. So if you saw the headlines and assumed this is a way to own crypto's biggest earners, it is not.
Moreover, a token needs at least 30% of its supply actually circulating to qualify, which quietly disqualifies projects whose headline valuations rest on coins nobody can sell yet.
This rule runs on Artemis’ Outstanding Supply data, and nobody has written about it yet. The first change to the lineup is decided on the third Friday of August and takes effect September 18.
Robinhood Chain: What is actually happening under the hood
Start with what Robinhood Chain is, because most people skips this.
Robinhood Chain is an Arbitrum Orbit L2, which means Robinhood rents Ethereum’s security and runs its own cheap, fast transaction layer on top of it. It went live July 1.
The pitch was tokenized real-world assets: put stocks, ETFs and private equity onchain. Robinhood’s customers can trade them around the clock, including in places where opening a US brokerage account is not an option. However, what actually launched was a memecoin casino and what is happening now is that the casino is slowly turning into the thing it was supposed to be (tokenization of RWAs).
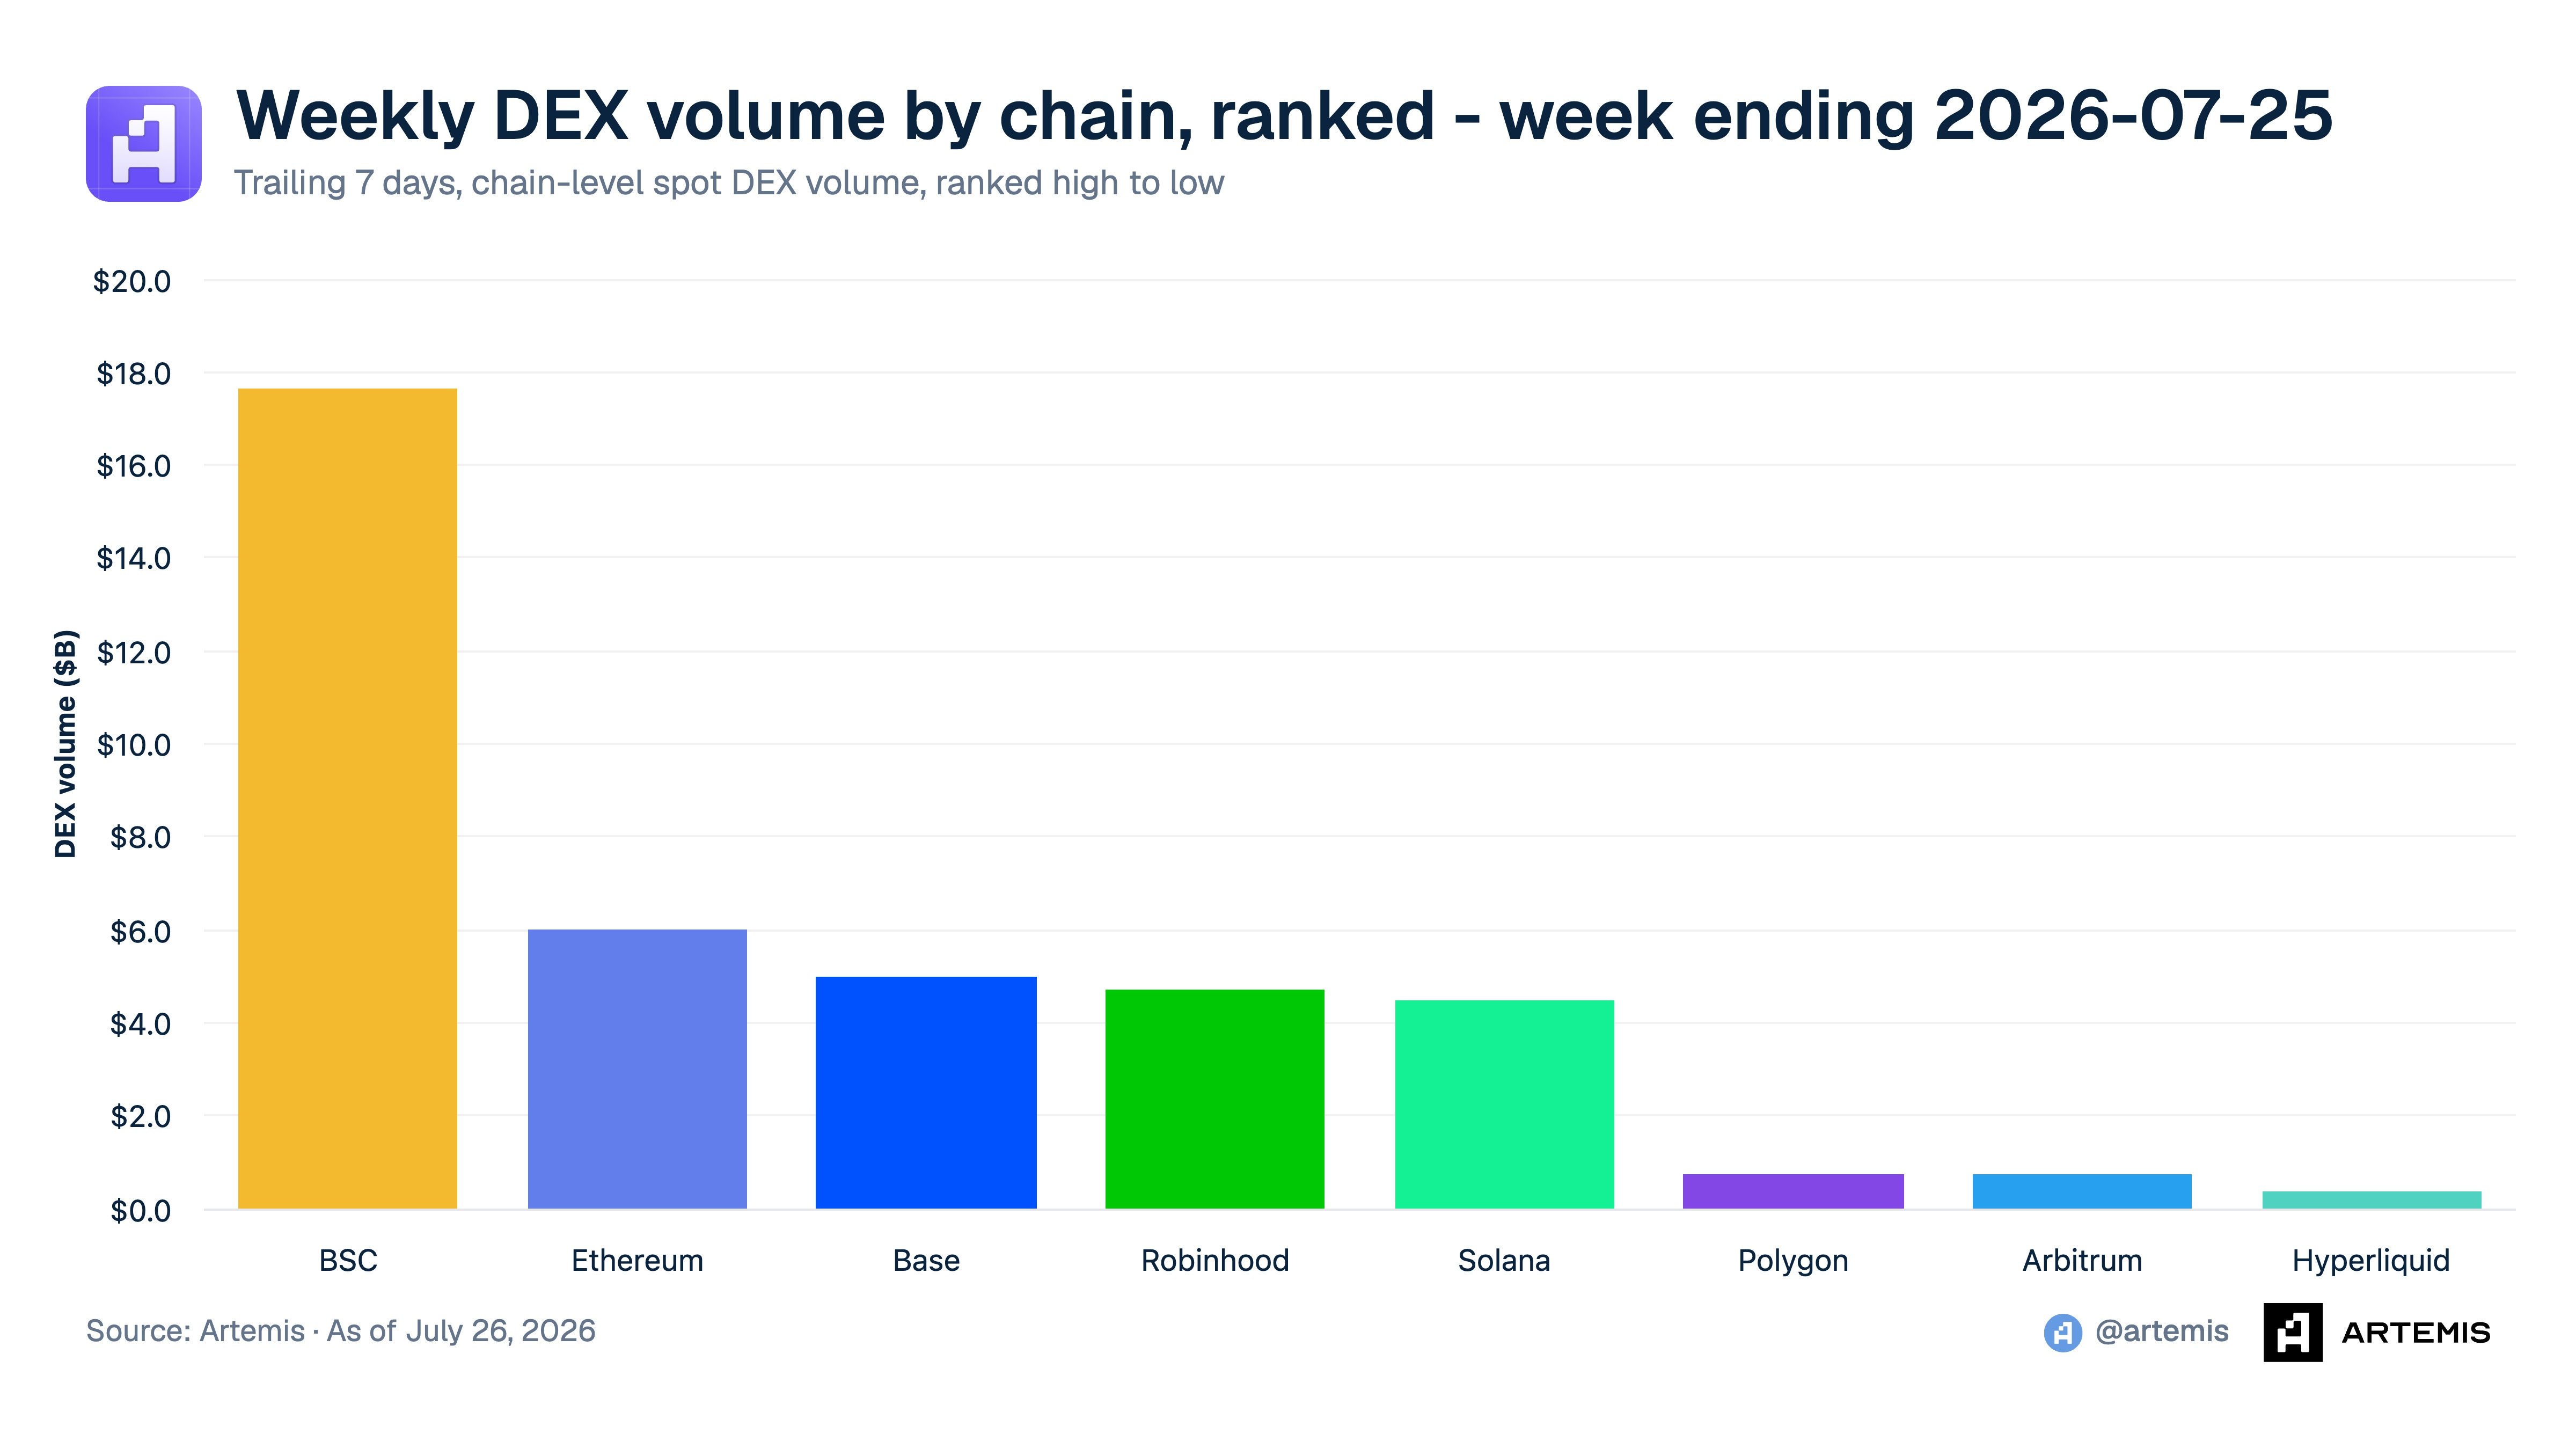
Just last week, we showed Robinhood Chain as the leading chain by DEX volume, on a peak day. Over the full week of July 18-25 it ranks #4 at $4.7B, behind BSC, Ethereum and Base and ahead of Solana.
Activity on Robinhood Chain:
DEX Volume averages around ~$500M daily
DAUs averages around 250K users daily
Monthly Active Users hit an ATH of 2.1 million users
Roughly two thirds of the daily base is returning
Transactions averages around 6M daily
Fees averages around $200K daily

Most of the money on Robinhood’s chain is not Robinhood’s.
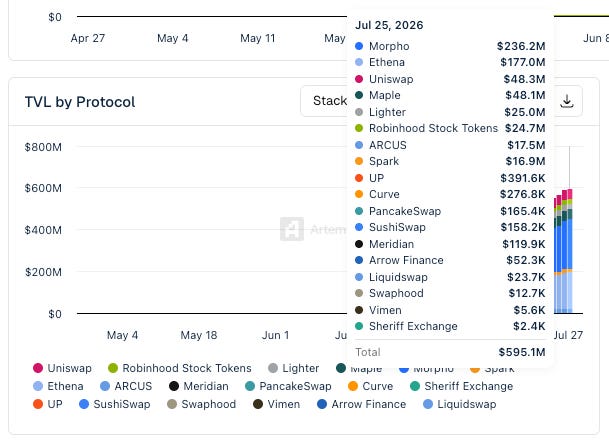
TVL sits at $595.1M as of July 25, up from essentially zero in mid-June. The composition is the story:
Morpho: $236.2M
Ethena: $177.0M
Uniswap: $48.3M
Maple: $48.1M
Lighter: $25.0M
Robinhood Stock Tokens: $24.7M
Morpho and Ethena are 70% of the chain between them. Robinhood Stock Tokens are 4.2%.
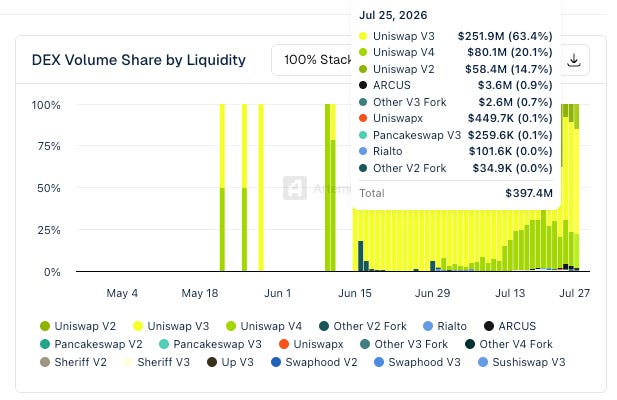
Uniswap owns the trading layer outright.
Of $397.4M in DEX volume on July 25:
Uniswap V3: $251.9M
Uniswap V4: $80.1M
Uniswap V2: $58.4M
Everything else combined: under $7M
That is 98% Uniswap. Arcus, PancakeSwap and every fork on the chain share the rest.
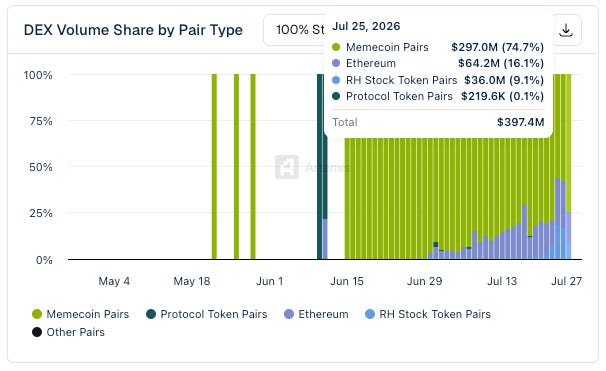
Memecoins still made up majority of all the DEX Volume:
Memecoin Pairs: $297.0M (74.7%)
Ethereum: $64.2M (16.1%)
Robinhood Stock Token Pairs: $36M (9.1%)
Protocol Token Pairs: $219.6K (0.1%)
One launchpad is most of the chain.
On July 25, pons.family did:
$99.7M of $155.8M in launchpad volume (64%)
1.3M of 1.6M launchpad transactions (81%)
11.2K of 17.6K tokens deployed (64%)
The next largest, Bankr, did $13.1M.
Over seven days pons.family generated $7.86M in gross fees on $826M of volume. Gas fees for the entire chain over the same period were roughly $1.51M.
The app layer earns about five times what the L2 does.

The thing it was built for: It is small, growing fast, and broader than stocks.
Total tokenized market cap on the chain is $24.8M:
Stocks: $19.1M
Private equities: $1.9M
ETFs: $1.5M
Commodities: $1.2M
US Treasuries: $800.1K
That is up from roughly $5.5M on June 29, about 4.5x in under a month. Tokenized-equity holders went from 29,407 to 48,470 in five days. Stock-token pairs are now 9.1% of DEX volume at $36M a day, against memecoins at 74.7%.

So what?
Robinhood built the distribution. Third parties captured the economics.
Morpho and Ethena hold the deposits. Uniswap clears the trades. Pons.family earns the fees. Robinhood collects base fees annualizing to roughly $78M.
That is the fat-app, thin-chain thesis with a public-company income statement attached.
Charts of the Week
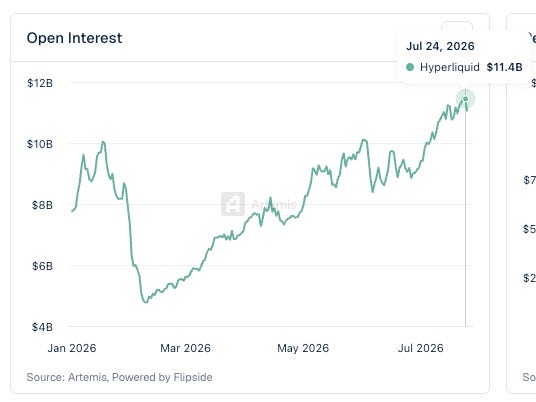
Hyperliquid OI hits ATH of $11.4B on July 24, 2026
Roughly $104M of net ethereum inflows of the last two weeks while bitcoin flows are choppy
Other Notable News
The London Stock Exchange announced LSE 24 on July 21, a 24/5 venue with agent-native access and onchain settlement, and the SEC announced a September 17 roundtable on 24-hour US equity trading two days later.
Strategy sold $263.5M of MSTR shares between July 13 and 19 and bought no bitcoin for a fourth straight week, lifting its USD reserve to $3.225B against roughly $1.76B of annual preferred and interest obligations.
Nine firms including Strategy, BlackRock, Coinbase and Galaxy pledged $15M over three years to bitcoin post-quantum research, with more than 7 million BTC sitting in outputs with exposed public keys.
Regulators blew past the GENIUS Act rulemaking deadline on July 18 with zero final rules across six agencies, pushing full effect to January 18, 2027, while stablecoin supply grew 18.6% to $308.1B anyway.
PayPal’s board formally rejected the $60.50 per share Stripe and Advent bid, hired Goldman Sachs and Evercore, and is holding out for closer to $70 ahead of its July 28 print.
CLARITY still has no cloture motion filed, with the August 7 recess as the gate.
Thanks for reading! Go deeper on any story above with Artemis Analyst, our AI analyst built on Artemis’s institutional data. Ask it anything (”chart Robinhood Chain stock-token volume by day,” “rank SPPDA constituents by protocol revenue”) and get data-backed answers, comps and charts in seconds, right in the Terminal. Or pull live numbers straight into your models with =ART() in Excel and Google Sheets.
Disclaimer: This newsletter is produced by Artemis for informational and educational purposes only. It does not constitute investment advice, a recommendation to buy or sell any security or digital asset, or an offer to provide advisory services. Artemis and its employees may hold positions in assets discussed. Figures are accurate to the best of our knowledge as of publication; markets move quickly.